Difference between revisions of "Backtrace"
| Line 7: | Line 7: | ||
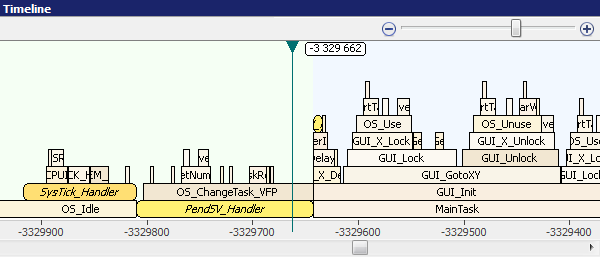
[[File:ozone-timeline.png | thumb | none | 600px | Timeline window in Ozone showing the backtrace data]] |
[[File:ozone-timeline.png | thumb | none | 600px | Timeline window in Ozone showing the backtrace data]] |
||
| + | Note: The backtrace buffer can be configured via the following exec command: |
||
| − | Note: Currently the back trace buffer is limited to the J-Trace memory (64 MB). Unlimited (host side buffering) is coming soon. |
||
| + | https://wiki.segger.com/J-Link_Command_Strings#TRACE_SetBackTraceMaxNumItems |
||
Latest revision as of 12:52, 13 February 2024
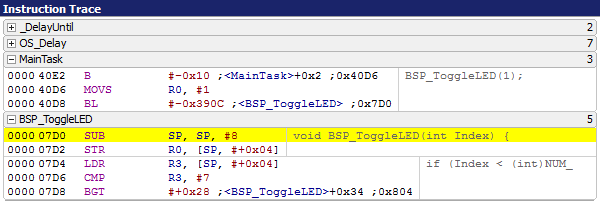
The so called backtrace is a list of all addresses that have been executed on the target device. That list is generated from the incoming instruction trace stream from the device and displayed once the target device is halted. This allows the debugger to display all executed instructions in a list which is comparable to a prolonged and more detailed callstack.
With that information it is possible to exactly follow the execution of the target application prior to the current PC like in a "time-machine". The backtrace data is also linked with the source code (if available) so when highlighting an instruction in the instruction trace window the debugger will display the corresponding source code line.
Further this information is displayed in a timeline to show the exact call history of the application.
Note: The backtrace buffer can be configured via the following exec command: https://wiki.segger.com/J-Link_Command_Strings#TRACE_SetBackTraceMaxNumItems

