Difference between revisions of "Configure instruction trace in Embedded Studio"
(Created page with "In general, to get ETB up and running, just make sure to configure ETB as ''Trace Interface Type'' in the Embedded Studio project settings: ''Debugger'' --> ''Target Trace Op...") |
m (Fabian moved page Configure ETB Trace in Embedded Studio to Configure instruction trace in Embedded Studio: Expanded article) |
(No difference)
| |
Revision as of 16:17, 28 May 2020
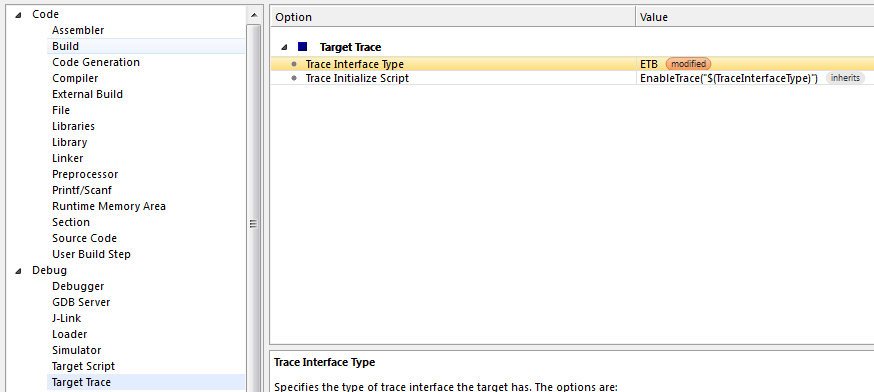
In general, to get ETB up and running, just make sure to configure ETB as Trace Interface Type in the Embedded Studio project settings:
Debugger --> Target Trace Options --> Trace Interface Type --> ETB
Once the debug session has been started, the most recent executed instructions will be shown in the instruction backtrace window. The window can be opened at:
Debug --> Other windows --> Execution Trace
File:ES ExecutionTrace ETB.png
ETB trace on NXP TWR-K65F
ETB trace with the OpenSDA on-board which is on the NXP TWR-K65F board and for which SEGGER also provide a firmware. Further information regarding the J-Link OpenSDA firmware can be found on the SEGGER webpage: https://www.segger.com/opensda.html.
Below a sample project that is already prepared for ETB trace on the K65 is available for download.
