Difference between revisions of "Configure instruction trace in Embedded Studio"
| (3 intermediate revisions by the same user not shown) | |||
| Line 3: | Line 3: | ||
__TOC__ |
__TOC__ |
||
| − | = MTB = |
+ | == MTB == |
In general, to get MTB up and running, just make sure to configure MTB as ''Trace Interface Type'' in the Embedded Studio project settings:<br> |
In general, to get MTB up and running, just make sure to configure MTB as ''Trace Interface Type'' in the Embedded Studio project settings:<br> |
||
''Debugger'' > ''Target Trace Options'' > ''Trace Interface Type'' > ''ETB'' |
''Debugger'' > ''Target Trace Options'' > ''Trace Interface Type'' > ''ETB'' |
||
| − | = ETB/ETF/TMC = |
+ | == ETB/ETF/TMC == |
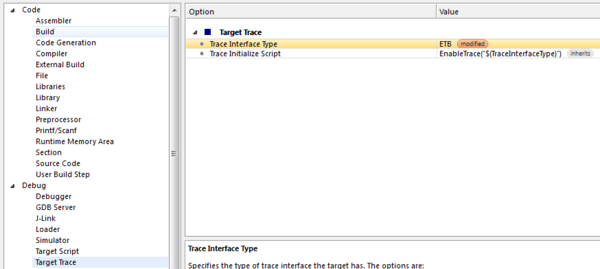
In general, to get ETB/.. up and running, just make sure to configure ETB as ''Trace Interface Type'' in the Embedded Studio project settings:<br> |
In general, to get ETB/.. up and running, just make sure to configure ETB as ''Trace Interface Type'' in the Embedded Studio project settings:<br> |
||
''Debugger'' > ''Target Trace Options'' > ''Trace Interface Type'' > ''ETB'' |
''Debugger'' > ''Target Trace Options'' > ''Trace Interface Type'' > ''ETB'' |
||
[[File:ES_ProjectConfiguration_ETB.png | thumb | none | 600px | Selection of ETB in ES]] |
[[File:ES_ProjectConfiguration_ETB.png | thumb | none | 600px | Selection of ETB in ES]] |
||
| − | = Pin trace (ETM/PTM) = |
+ | == Pin trace (ETM/PTM) == |
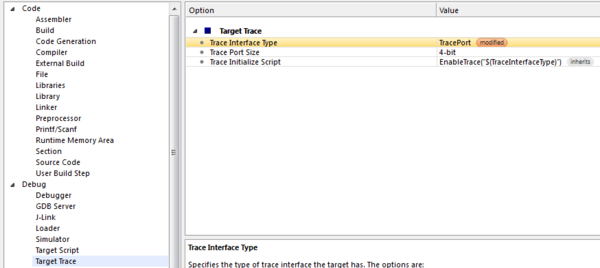
In general, to get ETM/PTM up and running, just make sure to configure ETB as ''Trace Interface Type'' in the Embedded Studio project settings:<br> |
In general, to get ETM/PTM up and running, just make sure to configure ETB as ''Trace Interface Type'' in the Embedded Studio project settings:<br> |
||
''Debugger'' > ''Target Trace Options'' > ''Trace Interface Type'' > ''ETM'' |
''Debugger'' > ''Target Trace Options'' > ''Trace Interface Type'' > ''ETM'' |
||
[[File:ES_ProjectConfiguration_ETM.png | thumb | none | 600px | Selection of ETM in ES]] |
[[File:ES_ProjectConfiguration_ETM.png | thumb | none | 600px | Selection of ETM in ES]] |
||
| − | = Result = |
+ | == Result == |
Once the debug session has been started, the most recent executed instructions will be shown in the instruction back trace window. The window can be opened at:<br> |
Once the debug session has been started, the most recent executed instructions will be shown in the instruction back trace window. The window can be opened at:<br> |
||
''Debug'' > ''Other windows'' > ''Execution Trace'' |
''Debug'' > ''Other windows'' > ''Execution Trace'' |
||
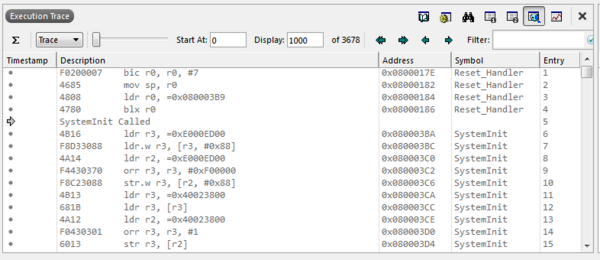
[[File:ES_ExecutionTrace_ETM.png | thumb | none | 600px | Example instruction trace output]] |
[[File:ES_ExecutionTrace_ETM.png | thumb | none | 600px | Example instruction trace output]] |
||
| + | == Simulator == |
||
| − | = Sample projects = |
||
| + | In the Embedded Studio simulator instruction tracing is always enabled by default. Simply open the "Execution Trace" and "Execution Profile" windows and you should be able to see the trace data. |
||
| + | |||
| + | == Sample projects == |
||
A constantly updated list of tested sample project can be found on the [https://www.segger.com/products/debug-probes/j-trace/technology/tested-devices/ SEGGER homepage].<br> |
A constantly updated list of tested sample project can be found on the [https://www.segger.com/products/debug-probes/j-trace/technology/tested-devices/ SEGGER homepage].<br> |
||
| − | All projects come with an Embedded Studio and Ozone project |
+ | All projects come with an Embedded Studio and Ozone project. |
Latest revision as of 11:23, 22 October 2020
This article explains how to enable instruction trace in Embedded Studio.
MTB
In general, to get MTB up and running, just make sure to configure MTB as Trace Interface Type in the Embedded Studio project settings:
Debugger > Target Trace Options > Trace Interface Type > ETB
ETB/ETF/TMC
In general, to get ETB/.. up and running, just make sure to configure ETB as Trace Interface Type in the Embedded Studio project settings:
Debugger > Target Trace Options > Trace Interface Type > ETB
Pin trace (ETM/PTM)
In general, to get ETM/PTM up and running, just make sure to configure ETB as Trace Interface Type in the Embedded Studio project settings:
Debugger > Target Trace Options > Trace Interface Type > ETM
Result
Once the debug session has been started, the most recent executed instructions will be shown in the instruction back trace window. The window can be opened at:
Debug > Other windows > Execution Trace
Simulator
In the Embedded Studio simulator instruction tracing is always enabled by default. Simply open the "Execution Trace" and "Execution Profile" windows and you should be able to see the trace data.
Sample projects
A constantly updated list of tested sample project can be found on the SEGGER homepage.
All projects come with an Embedded Studio and Ozone project.


