Configure instruction trace in Embedded Studio
This article explains how to enable instruction trace in Embedded Studio.
MTB/ETB/ETF/TMC
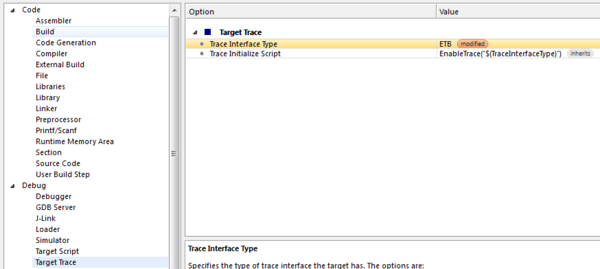
In general, to get ETB/MTB/.. up and running, just make sure to configure ETB as Trace Interface Type in the Embedded Studio project settings:
Debugger > Target Trace Options > Trace Interface Type > ETB
Pin trace (ETM/PTM)
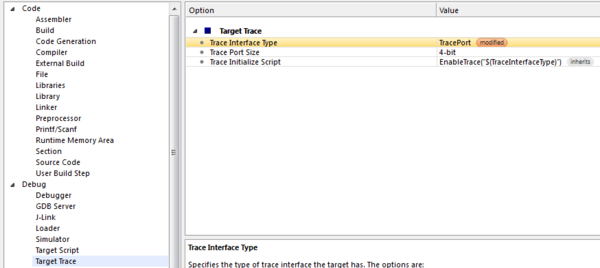
In general, to get ETM/PTM up and running, just make sure to configure ETB as Trace Interface Type in the Embedded Studio project settings:
Debugger > Target Trace Options > Trace Interface Type > ETM
Result
Once the debug session has been started, the most recent executed instructions will be shown in the instruction back trace window. The window can be opened at:
Debug > Other windows > Execution Trace
Sample projects
A constantly updated list of tested sample project can be found on the SEGGER homepage.
All projects come with an Embedded Studio and Ozone project, working out-of-the-box.

