Embedded Studio with GDB Server
Embedded Studio directly integrates debugging support with J-Link. In addition third-party debug probes are supported via the GDB Server Interface. Any debug probe that can be controlled via GDB Server or an equivalent tool, such as OpenOCD, can be used for debugging with Embedded Studio.
Embedded Studio uses the GDB remote debugging protocol to communicate with the GDB Server and supports the standard debugging features. Embedded Studio can automatically launch the 3rd party GDB Server upon starting a debug session, keeping debugging easy and convenient. Port number, host and protocol features are configurable for maximum flexibility.
Contents
J-Link GDB Server
Note: It is recommended to use the native J-Link Support instead of the J-Link GDB Server.
To debug using J-Link GDB Server, open the project options and set:
- Debug -> Debugger -> Target Connection to "GDB Server"
- Debug -> GDB Server -> Type to "J-Link"
The GDB Server Command Line is used to start J-Link GDB Server. For the installation path the macro $(JLinkDir) can be used. Additionally at least the device name need to be set and if necessary the target connection needs to be configured via command line optoions.
The default GDB Server Command Line is "$(JLinkDIR)/JLinkGDBServerCL" -device "$(DeviceName)" -silent.
The default connection is "localhost" on port 2331. If another port should be used, change the project option as well as the command line option -port.
ST-Link GDB Server
Embedded Studio project settings
To debug using ST-Link GDB Server, open the project options and set:
- Debug -> Debugger -> Target Connection to "GDB Server"
- Debug -> GDB Server -> Type to "ST-LINK"
Other settings can be left at default.
The GDB Server Command Line is used to start ST-Link GDB Server. It is part of the STM32CubeIDE.
How to start the ST-Link GDB Server
How to start the ST-Link GDB Server is described in the ST manual called UM2576.
Here are the required steps in short (STM32CubeIDE v1.8.0 used for reference):
- Install the latest STM32CubeIDE software.
- Open your host OS terminal e.g. Windows Command Prompt
- Navigate to the installation folder of the ST-Link GDB Server (default: C:\ST\STM32CubeIDE_1.8.0\STM32CubeIDE\plugins\com.st.stm32cube.ide.mcu.externaltools.stlink-gdb-server.win32_2.0.100.202109301221\tools\bin)
- Make sure your ST-Link is connected to your host PC.
- Open the GDB Server with the documented command line parameters.
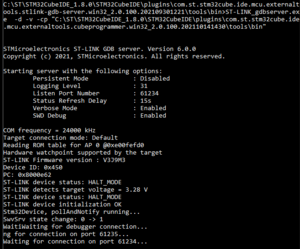
- Example: ST-LINK_gdbserver.exe -d -v -cp "C:\ST\STM32CubeIDE_1.8.0\STM32CubeIDE\plugins\com.st.stm32cube.ide.mcu.externaltools.cubeprogrammer.win32_2.0.100.202110141430\tools\bin"
- If everything worked correctly you should see the following screen:
- Now simply start the debug session in Embedded Studio with the settings above and you should be able to debug with the ST-Link in Embedded Studio.
Additional Settings
Optionally you can also let Embedded Studio open the GDB Server automatically with the following project options:
- Debug > GDB Server > GDB Server Command Line
- Debug > GDB Server > Auto Start GDB Server
OpenOCD
- Under project options -> Debug -> Debugger Select "GDB Server" as interface.
- Under project options -> Debug -> GDB Server set the path to the GDB Server executable (under Windows: openocd.exe), pass the config file for the target via the -f command line option and finally select "Yes" for "Auto Start GDB Server"
- Start a debug session as usual (F5)
OpenOCD can either be build from source here or alternatively, binaries (pre-build .exe etc.) may be downloaded from here
Other GDB Servers
Other GDB Servers or equivalent tools can be used with Embedded Studio, too.
Set Debug -> GDB Server -> Type to "Generic" and set up the options accordingly.


