Difference between revisions of "J-Link Control Panel"
(→Misc.) |
(→RTT) |
||
| (One intermediate revision by the same user not shown) | |||
| Line 251: | Line 251: | ||
For general information about RTT, please refer to [[RTT]]. |
For general information about RTT, please refer to [[RTT]]. |
||
| + | |||
| + | ==== Manual start ==== |
||
| + | {| class="wikitable" |
||
| + | ! Element !! Explanation |
||
| + | |- |
||
| + | | Control block address || Address of the RTT control block (Set by user). |
||
| + | |- |
||
| + | | Start button || Starts RTT. |
||
| + | |- |
||
| + | |} |
||
==== Status & Settings ==== |
==== Status & Settings ==== |
||
| Line 257: | Line 267: | ||
! Element !! Explanation |
! Element !! Explanation |
||
|- |
|- |
||
| − | | |
+ | | Running || LED indicating if RTT is active or not (green == active) |
| + | |- |
||
| + | | TELNET port || TELNET port used for RTT. |
||
|- |
|- |
||
| Status || Status of the RTT session. Indicates, if the RTT control block has been found and the address it was found at. |
| Status || Status of the RTT session. Indicates, if the RTT control block has been found and the address it was found at. |
||
|- |
|- |
||
| − | | |
+ | | Mode || RTT mode used. |
| + | |- |
||
| + | | Control block || Shows the control block address and how it was found. |
||
|- |
|- |
||
| Data rate || Data rate [bytes/s]. |
| Data rate || Data rate [bytes/s]. |
||
| Line 286: | Line 300: | ||
{| class="wikitable" |
{| class="wikitable" |
||
! Element !! Explanation |
! Element !! Explanation |
||
| + | |- |
||
| + | | Show data for channel || Select the channel data is supposed to shown for. |
||
| + | |- |
||
| + | | Show data as || Select if data is shown as bytes (HEX) or strings. |
||
|- |
|- |
||
| Send CR on <Return> || If checked a carriage return (<tt>\r</tt>) character is appended to the data sent to the target. |
| Send CR on <Return> || If checked a carriage return (<tt>\r</tt>) character is appended to the data sent to the target. |
||
Revision as of 16:50, 23 September 2022
The J-Link web control panel allows the user to monitor the J-Link status and the target status information in real-time.
It also allows the user to configure the use of some J-Link features such as flash download, flash breakpoints and instruction set simulation.
The J-Link web control panel can be accessed via the J-Link tray icon () in the tray icon list or via http://localhost:19080. This icon is available when a debug session is started.
To open the status page, simply click on the tray icon.
Tabs
The J-Link web control panel supports different features which are grouped in tabs. The organization of each tab and the functionality which is behind these groups will be explained in this section.
General
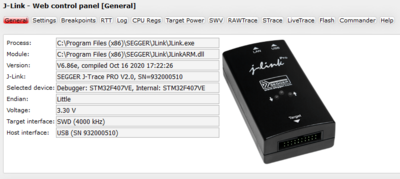
In the General section, general information about J-Link and the target hardware is shown:
| Element | Meaning |
|---|---|
| Process | Path of the file which loaded the DLL. |
| Module | Path of the DLL invoking this Web control panel instance. |
| Version | DLL version and compile date. |
| J-Link | OEM of the connected J-Link, the hardware version and the Serial number. |
| Selected device | Selected device. |
| Endian | Target endieness. |
| Voltage | Target current measured between ground pin (GND) and reference pin (VTref). |
| Target interface | Shows the selected target interface (JTAG/SWD) and the current JTAG speed. |
| Host interface | Shows the host interface that is selected and the IP or SN of the J-Link. |
Settings
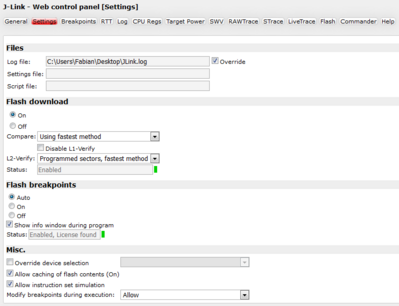
In the Settings section project- and debug-specific settings can be set. It allows the configuration of the use of flash download and flash breakpoints and some other target specific settings which will be explained in this topic. Settings are saved in registry.
Files
In the Files section, the following information is shown:
| Element | Meaning |
|---|---|
| Log file | Path to the active J-Link log file. |
| Settings file | Path to the active Settings file. |
| Script file | Path to the currently used J-Link script file. |
Additionally, the log file override can be activated. If activated, the J-Link log file will be created at the path shown under "Log file".
Flash download
In the Flash download section, settings for the use of the J-Link FlashDL feature and related settings can be configured.
| Element | Explanation |
|---|---|
| Flash download | On - Enables the J-Link FlashDL feature. Off - Disables the J-Link FlashDL feature. |
| Compare | Compare method. |
| L1-Verify | Disable/Enable L1 verify. |
| L2-Verify | L2 verification method. |
| Status | Enabled (green LED) - Flash downloads enabled. Disabled (red LED) - Flash downloads disabled |
Flash breakpoints
In the Flash breakpoint section, settings for the use of the FlashBP feature and related settings can be configured. When a license for FlashBP is found, the color indicator is green and "Enabled, license found" appears right to the FlashBP usage settings.
| Element | Explanation | ||||||||
|---|---|---|---|---|---|---|---|---|---|
| Flash breakpoints |
| ||||||||
| Show window during program | When this checkbox is enabled the "Programming flash" window is shown when flash is re-programmed in order to set/clear flash breakpoints. | ||||||||
| Status | Indicates if flash breakpoints are enabled and if a license for the FlasBP feature was found. |
Misc
In the Misc. section, some additional settings can be set.
| Element | Explanation | ||||||||||
|---|---|---|---|---|---|---|---|---|---|---|---|
| Override device selection | If enabled, Manual device selection is enabled. This especially makes sense when J-Link can not identify the device name given by the debugger or if a particular device is not yet known to the debugger, but to the J-Link software. | ||||||||||
| Allow caching of flash contents | If enabled, the flash contents are cached by J-Link to avoid reading data twice. This speeds up the transfer between debugger and target. | ||||||||||
| Allow instruction set simulation | If enabled, instructions will be simulated as far as possible. This speeds up single stepping, especially when FlashBPs are used. | ||||||||||
| Modify breakpoints during execution | Allows the user to change the behavior of the DLL when setting breakpoints if the CPU is running. The following options are available:
|
Breakpoints
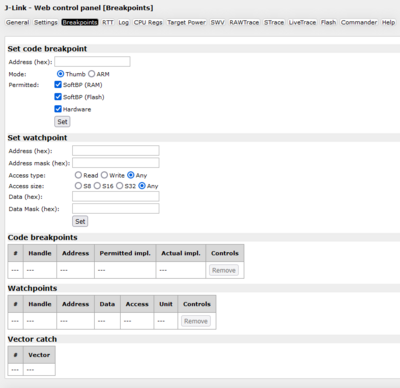
In this section all breakpoints and watchpoints which are in the DLL internal breakpoint and watchpoint list are shown.
It is possible for the debugger to bypass the breakpoint functionality of the J-Link software by writing to the debug registers directly. This means for ARM7/ARM9 cores write accesses to the ICE registers, for Cortex-M3 devices write accesses to the memory mapped flash breakpoint registers and in general simple write accesses for software breakpoints (if the program is located in RAM). In these cases, the J-Link software cannot determine the breakpoints set and the list is empty.
Set code breakpoint
In this section, a code breakpoint can be set.
| Element | Explanation |
|---|---|
| Adress | Specifies the Address of the breakpoint to be set. |
| Mode | Defines if the break point to be set is in Thumb or ARM bode. |
| Permitted | Defines which kind of breakpoints is permitted:
|
| Set | Sets a break point with the specifications defined above. |
Set watchpoint
In this section, a code breakpoint can be set.
| Element | Explanation | ||||||||||
|---|---|---|---|---|---|---|---|---|---|---|---|
| Adress | Specifies the address of the watchpoint to be set. | ||||||||||
| Adress mask | Specifies the address mask used for comparison. Bits set to 1 are masked out, so not taken into consideration during address comparison. [1] | ||||||||||
| Access type | Defines which type of access is watched.
| ||||||||||
| Access size | Specifies the access size on which the watchpoint will trigger.
| ||||||||||
| Data | Specifies the Data on which the watchpoint is to be set. | ||||||||||
| Data Mask | Specifies data mask used for comparison. Bits set to 1 are masked out, so not taken into consideration during data comparison.[1] | ||||||||||
| Set | Sets a break point with the specifications defined above. |
Example - Set watchpoint
- Do break on access to address 0x20000000
- Do break only on access to this specific address, and not on an address range
- Do break on any access type
- Do break on all access sizes
- Do not care for the value of the data at this address.
| Address: | 0x20000000 |
| Address mask: | 0x0 |
| Data: | 0x0 |
| Data mask: | 0xFFFFFFFF |
Code breakpoints
List of all code breakpoints which are in the DLL internal breakpoint list.
| Element | Explanation |
|---|---|
| Handle | Handle of the breakpoint. |
| Address | Address where the breakpoint is set. |
| Permitted impl. | Permitted implementation (see "Permitted" in Set code breakpoint). |
| Actual impl. | The actual breakpoint implementation type. |
Data breakpoints
List of all data breakpoints which are in the DLL internal breakpoint list.
| Element | Explanation |
|---|---|
| Handle | Handle of the breakpoint. |
| Address | Address where the breakpoint is set. |
| Data | Breakpoint data and mask. |
| Access | Access type (8-, 16-, 32-bit, Write/Read). |
| Unit | Unit type. |
Vector catch
List of all active vector catches which are in the DLL internal list.
| Element | Explanation |
|---|---|
| Vector | Vector, a catch is enabled for. |
RTT
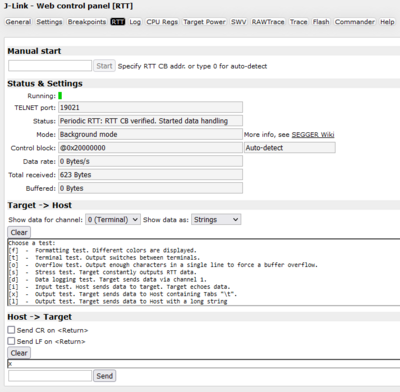
The RTT tab is a RTT interface. It provides
- general information about the current RTT session.
- the ability to start and stop RTT.
- RTT I/O functionality (reading and sending RTT data via different channels).
For general information about RTT, please refer to RTT.
Manual start
| Element | Explanation |
|---|---|
| Control block address | Address of the RTT control block (Set by user). |
| Start button | Starts RTT. |
Status & Settings
This sections shows information about the current RTT session and provides the selection of some RTT settings.
| Element | Explanation |
|---|---|
| Running | LED indicating if RTT is active or not (green == active) |
| TELNET port | TELNET port used for RTT. |
| Status | Status of the RTT session. Indicates, if the RTT control block has been found and the address it was found at. |
| Mode | RTT mode used. |
| Control block | Shows the control block address and how it was found. |
| Data rate | Data rate [bytes/s]. |
| Total received | Total data received via RTT [bytes]. |
| Buffered | Data currently buffered in the DLL [bytes]. |
Target -> Host
This section handles the data from target to host.
| Element | Explanation |
|---|---|
| Show data for channel | Selects from which channel data is supposed to be shown. |
| Clear button | Clears the received data log. |
| Log | Shows the data received from the target via RTT. |
Host -> Target
This section handles the data from host to target.
| Element | Explanation |
|---|---|
| Show data for channel | Select the channel data is supposed to shown for. |
| Show data as | Select if data is shown as bytes (HEX) or strings. |
| Send CR on <Return> | If checked a carriage return (\r) character is appended to the data sent to the target. |
| Send LF on <Return> | If checked a line feed (\n) character is appended to the data sent to the target. |
| Clear button | Clears the sent data log. |
| Log | Shows the data received from the target via RTT. |
| Line edit | Data to be sent to the target. |
| Send button | Sends the data inside the line edit to the target device. |
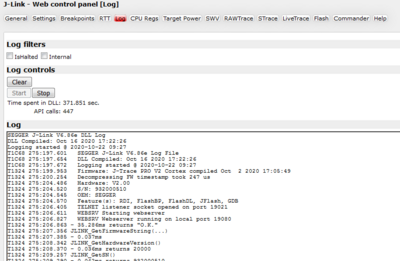
Log
In this section the log output of the DLL is shown. Additionally, some filters can be applied and the active DLL time + the count of API calls is shown. The user has the following options:
- Filtering the log
- Clear the log
- Start and Stop showing data in the Log window.
CPU Regs
The CPU regs tab shows the name and the value of the CPU registers.
Additionally, the user can set the values currently written in the CPU registers.
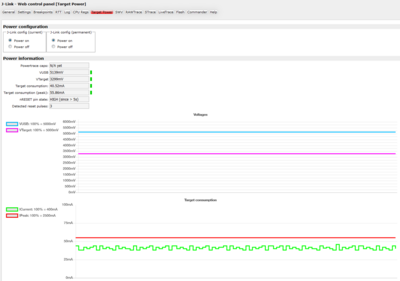
Target Power
The target power Tab provides information about the following:
- Current on USB side
- Current on Target side.
- Power consumption on target side (see Target Power - Limitations)
- Current state of the reset pin
- Count of detected reset pulses
The user can also change the power configuration of the J-Link in this tab.
Target Power - Limitations
The power consumption feature, as well as the power configuration feature can only be used if the connected probe supports it.
The J-Link EDU Mini for example does not support these features.
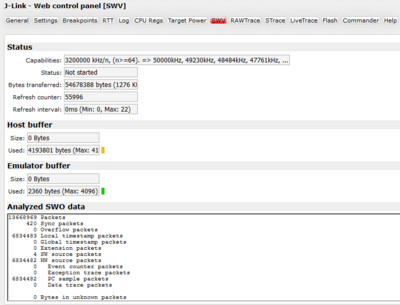
SWV
In the SWV tab, SWV information is shown.
| Element | Explanation | ||||
|---|---|---|---|---|---|
| Status | |||||
| Capabilities | Available SWV baudrates supported by the connected emulator. | ||||
| Status | Encoding and baudrate of the SWV data received by the target (Manchester/UART, currently J-Link only supports UART encoding). | ||||
| Bytes transferred | Total bytes transferred via SWV since debug session start. | ||||
| Refresh counter | Total count of SWV information updates in this section since debug session start. | ||||
| Refresh interval | Refresh interval. | ||||
| Host buffer | |||||
| Size | Reserved buffer size for SWV data on host side. | ||||
| Used | Used bytes of the host buffer. | ||||
| Emulator buffer | |||||
| Size | eserved buffer size for SWV data on emulator side. | ||||
| Used | Used bytes of the emulator buffer. | ||||
| Analyzed SWO data | |||||
| Log window | SWO data package information. | ||||
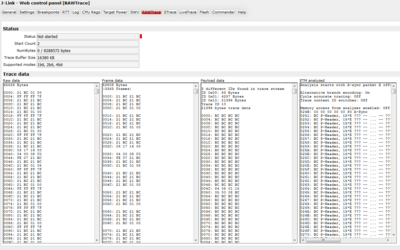
RAWTrace
Status
| Element | Meaning |
|---|---|
| Status | Trace status. If active, shows the Trace clock in [Hz]. |
| Start Count | Trace start count. Shows how often trace was started during the current debug session. |
| NumBytes | NumBytes read from the Trace buffer / NumBytes of data in the Trace buffer. |
| Trace Buffer Size | J-Link internal trace buffer size. |
| Supported modes | Supported ETN-Trace modes (1-,2-,4-bit tracing). |
Trace data
| Element | Meaning |
|---|---|
| Raw data | Raw trace data received from device. |
| Frame data | Raw trace data as frames (without Full-Syncs). |
| Payload data | Data read from frames for ETM-ID. |
| ETM analyzed | Gapless program flow analysis results. |
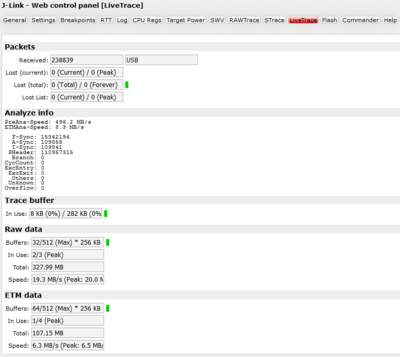
LiveTrace
| Element | Meaning |
|---|---|
| Packets | |
| Received | Number of packets received and connection details (USB/IP + Address). |
| Lost (current) | Number of packets lost since Trace start |
| Lost (total) | Number of total packets lost during the debug session. |
| Lost List | Packet lost list counter. |
| Analyze info | |
| Analyze info | Shows information about analysis speeds and analyzed packets. |
| Trace buffer | |
| In use | Shows current and maximum number of the Trace buffers that are in use / can be used. |
| Raw data | |
| Buffers |
|
| In Use |
|
| Total | Size of raw trace data written into buffer since start of trace. |
| Speed |
|
| ETM data | |
| Buffers |
|
| In Use |
|
| Total | Size of ETM trace data written into buffer since start of trace. |
| Speed |
|
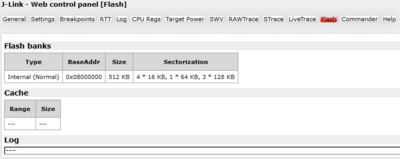
Flash
The Flash tab shows the addresses and internal names of the flash banks supported for the connected device.
Furthermore the areas of cached memory are shown.
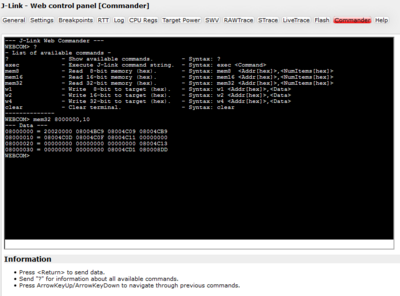
Commander
The J-Link Web Commander provides a terminal that can be seen as a smaller version of the J-Link Commander, with a significantly smaller command set. This way, the user can adjust settings and read/write memory, from an active debug session. This is especially useful when using IDEs that only provide limited features which the J-Link provides by default.
| Command | Explanation | Syntax |
|---|---|---|
| ? | Show available commands. | ? |
| exec | Execute J-Link command string. | exec <Command> |
| mem8 | Read 8-bit memory (hex). | mem8 <Addr[hex]>,<NumItems[hex]> |
| mem16 | Read 16-bit memory (hex). | mem16 <Addr[hex]>,<NumItems[hex]> |
| mem32 | Read 32-bit memory (hex). | mem32 <Addr[hex]>,<NumItems[hex]> |
| w1 | Write 8-bit to target (hex). | w1 <Addr[hex]>,<Data> |
| w2 | Write 16-bit to target (hex). | w2 <Addr[hex]>,<Data> |
| w4 | Write 32-bit to target (hex). | w4 <Addr[hex]>,<Data> |
| ih | Checks if the target is halted. | ih |
| clear | Clear terminal. | clear |
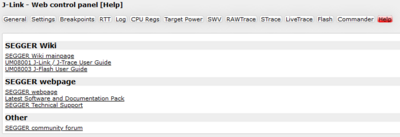
Help
The Help tab provides links to useful information sources.
