Difference between revisions of "Keil MDK-ARM"
(→Trace support) |
|||
| Line 47: | Line 47: | ||
Keil MDK supports various kinds of tracing features. A general overview of the different trace types can be found [https://wiki.segger.com/General_information_about_tracing here]. |
Keil MDK supports various kinds of tracing features. A general overview of the different trace types can be found [https://wiki.segger.com/General_information_about_tracing here]. |
||
| − | * SWO trace is fully |
+ | * SWO trace is fully supported with J-Link and J-Trace debug probes. |
* ETB/ETM trace is supported for Cortex-M0, M0+, M3 and M4. |
* ETB/ETM trace is supported for Cortex-M0, M0+, M3 and M4. |
||
| − | + | To trace other cores than the ones listed above it is recommended to use [https://www.segger.com/products/development-tools/ozone-j-link-debugger/ Ozone] instead. |
|
Revision as of 13:43, 27 June 2018
Keil MDK is a visual Studio style, commercial toolchain including a non-GCC compiler. We recommend to always install the latest J-Link software and documentation pack to make sure that Keil MDK uses the latest J-Link DLL.
Contents
Using J-Link with an existing project
- Open the project to configure
- Select Project --> Options for Target ... from the main menu
- Click the Device tab and select the proper device
- Click on the Debug tab and make sure that Cortex-M/R J-LINK / J-Trace is selected
- In order to modify J-Link specific settings click the Settings button in the debug menu and a new dialog will show up:
- Now the project is ready to be debugged with J-Link / J-Trace.


Using J-Link Flashloader
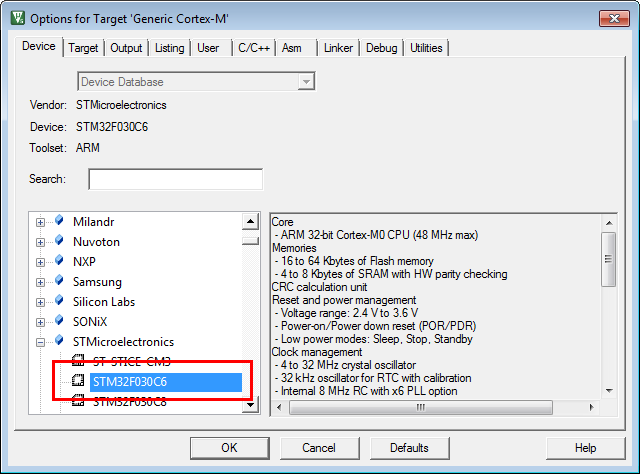
First, choose the right device in the project settings if not already done:
- Click Project | Options for Target from the main menu
- Switch to the Device tab
- Select the appropriate device, for example STM32F207IG

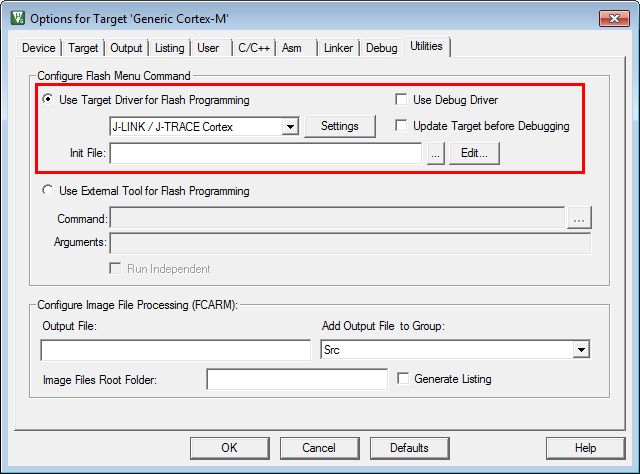
Secondly, enable SEGGER flash loader:
- Click Project | Options for Target from the main menu
- Switch to the Utilities tab
- Check Use Target Driver for Flash Programming
- Select J-LINK / J-Trace Cortex in order to use the J-Link built-in flashloader

Thirdly, configure flash loader:
- Click Project | Options for Target from the main menu
- Switch to the Debug tab
- Select J-LINK / J-Trace Cortex
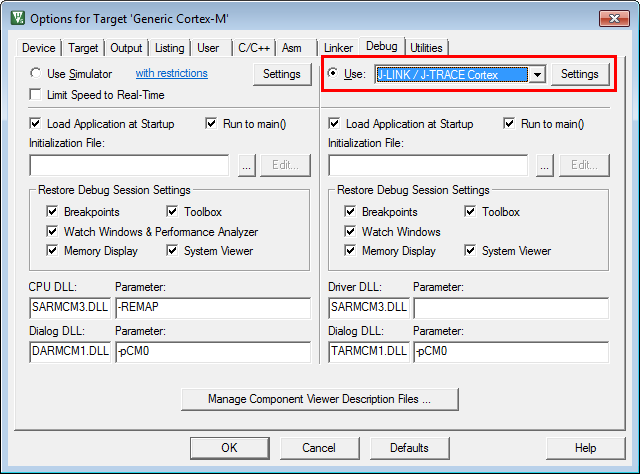

- Click Settings
- Check Verify Code Download and Download to Flash as shown in the screenshot below
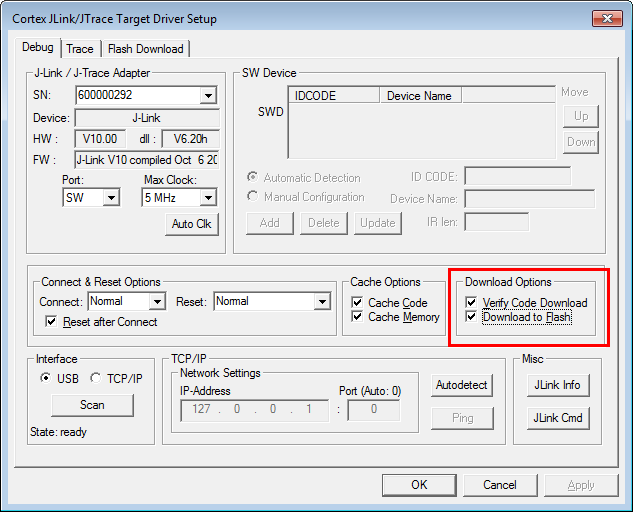

Please note that flash download through the "Download" (F8) is not supported for J-Link right now.
Support may be added in future versions of Keil MDK.
Using J-Link Script Files
Keil MDK-ARM does not provide any native support for J-Link script files so usage of them cannot be configured from within the GUI of the IDE itself. Anyhow, it is possible to use a J-Link script file by making use of the auto-search feature of the DLL:
- Navigate to the folder where the uVision project (*.uvproj, *.uvprojx) is located that shall use the script file.
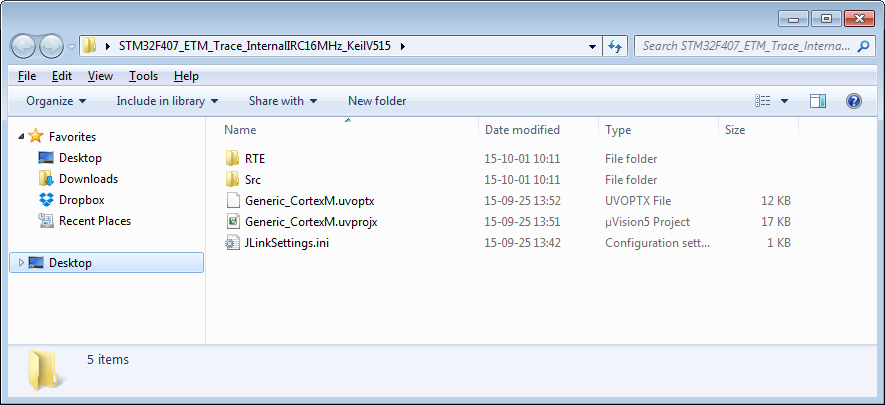
- Copy the J-Link script file to there
- Rename the J-Link script to JLinkSettings.JLinkScript
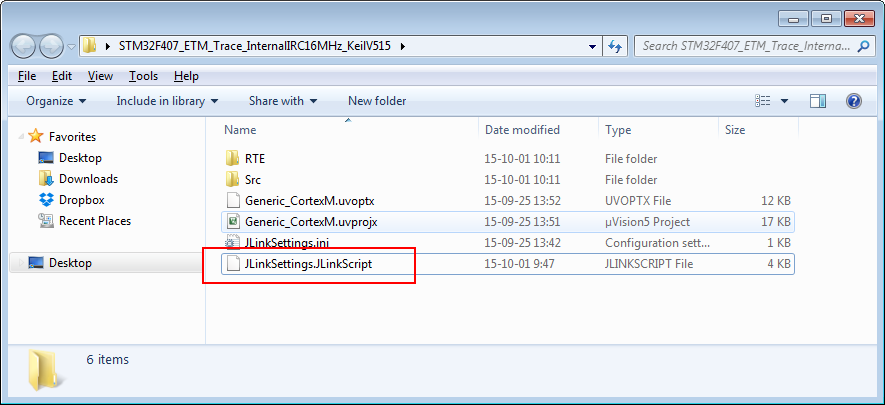


The JLinkSettings.ini is a settings file created by the J-Link DLL on debug session start. If no script file is explicitly passed to the DLL, it will search in the directory of the JLinkSettings.ini for a script file named like the settings file only with a different file extension.
Trace support
Keil MDK supports various kinds of tracing features. A general overview of the different trace types can be found here.
- SWO trace is fully supported with J-Link and J-Trace debug probes.
- ETB/ETM trace is supported for Cortex-M0, M0+, M3 and M4.
To trace other cores than the ones listed above it is recommended to use Ozone instead.