ON Semiconductor IDE
On Semiconductor IDE is a commercial IDE based on Eclipse that comes with J-Link and J-Trace support.
In order to use J-Link with On Semiconductor IDE, it is usually not necessary to separately install the J-Link software and documentation package since On Semiconductor IDE already comes with a option to install the needed J-Link software, like J-Link GDB Server that is automatically started when starting the debug session. In the following, a short explanation on how to create a simple project for an eval board with On Semiconductor IDE is given:
Contents
- 1 Creating a simple Project
- 1.1 Used components
- 1.2 Getting started
- 1.2.1 Creating a J-Link Debug Configuration
- 1.2.2 Configuring the target interface type
- 1.2.3 Configuring the target interface speed
- 1.2.4 Specifying the target device
- 1.2.5 Specifying J-Link GDB Server commandline options
- 1.2.6 J-Link Settings File
- 1.2.7 Using J-Link Command Strings
- 1.2.8 Using J-Link script files
- 1.2.9 Connecting to J-Link via J-Link Remote Server
- 1.3 Ready to Go
Creating a simple Project
Used components
| IDE | Emulator | J-Link SW Version | Evalboard |
|---|---|---|---|
| On Semiconductor IDE V3.4.0.48 | J-LInk | V6.98 | AXMOF343-256 |
Getting started
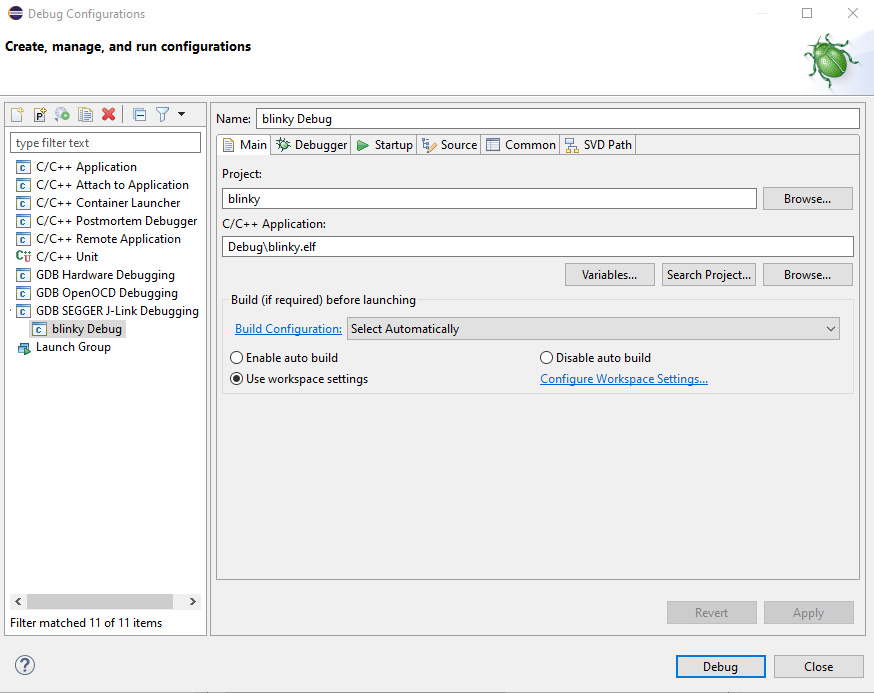
Creating a J-Link Debug Configuration
- Open Run -> Debug Configurations...
- Double click GDB SEGGER J-Link Debugging
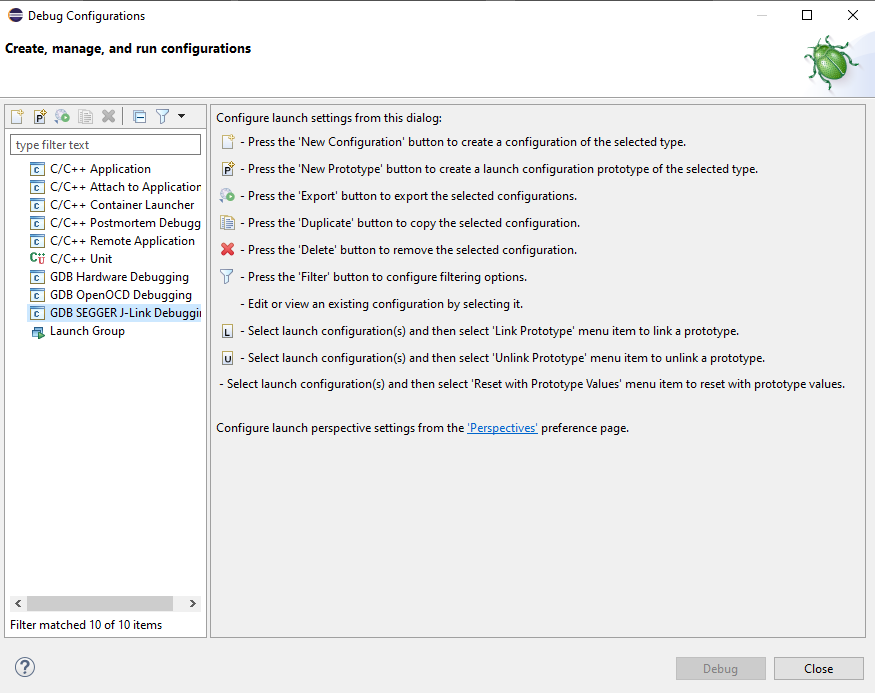
- On Semiconductor IDE will create a New Debug Configuration and set setting to defaults based on the workspace and project


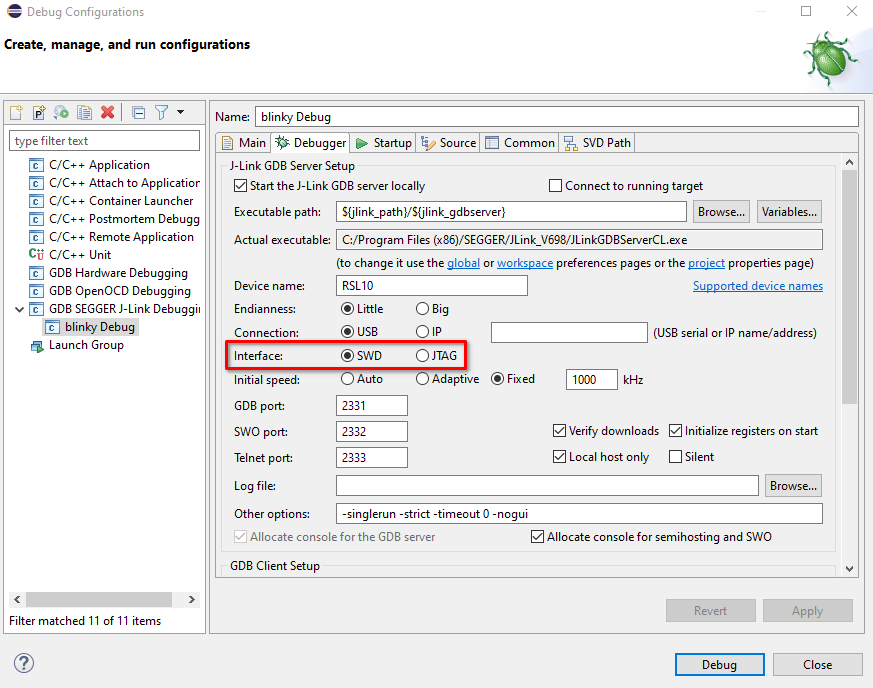
Configuring the target interface type
- Open Run -> Debug Configurations...
- On the left side, select the used Debug configuration in the group GDB SEGGER J-Link Debugging
- Switch to the tab Debugger
- The target interface can be selected in the area marked below

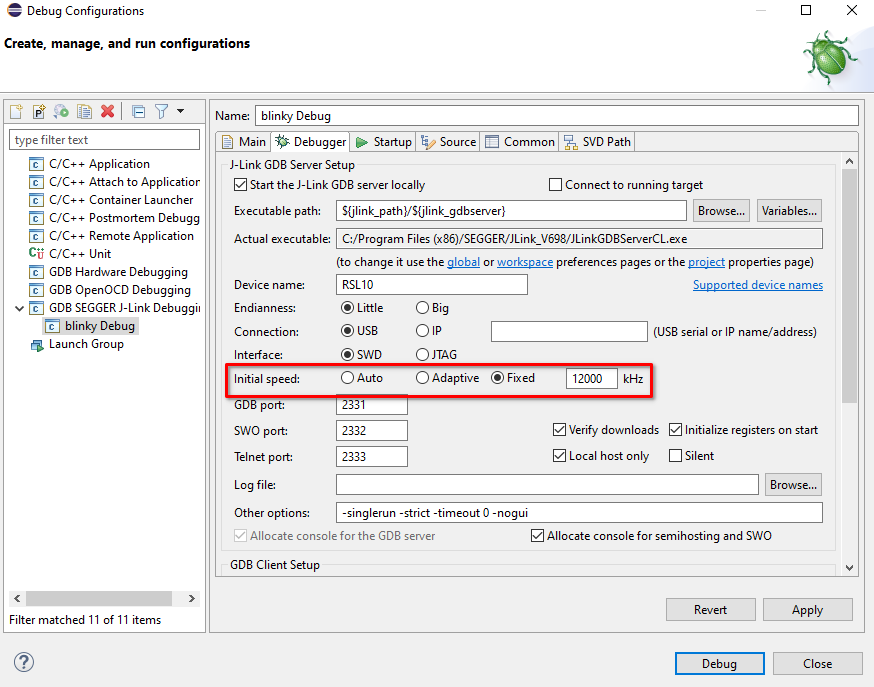
Configuring the target interface speed
- Initial interface speed before/during connect
- Open Run -> Debug Configurations...
- On the left side, select the used Debug configuration in the group GDB SEGGER J-Link Debugging
- Switch to the tab Debugger
- The interface speed before connect can be specified in the field Initial speed marked below
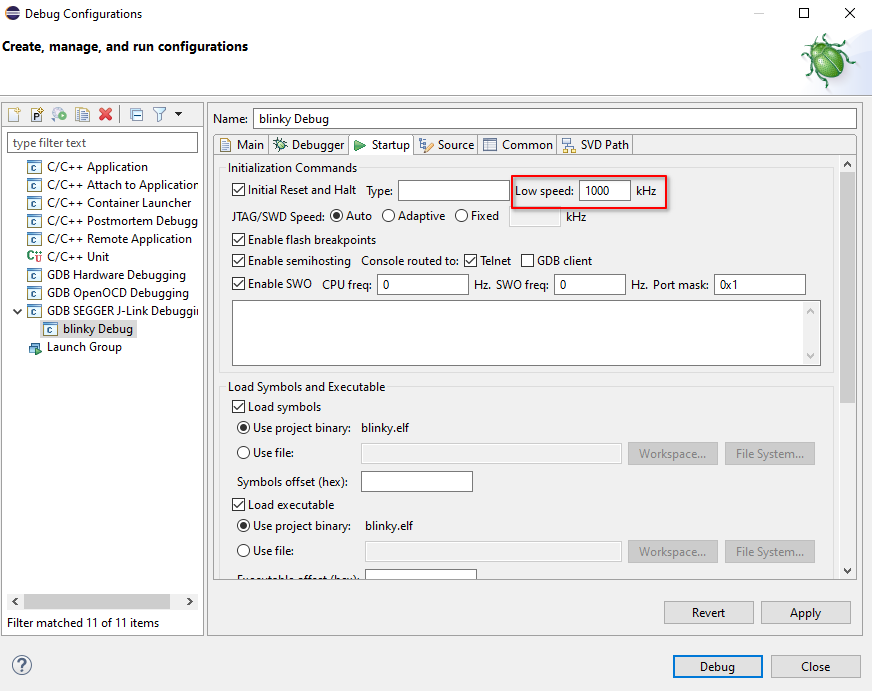
- Interface speed after connect to target before/during reset & halt
- Open Run -> Debug Configurations...
- On the left side, select the used Debug configuration in the group GDB SEGGER J-Link Debugging
- Switch to the tab Startup
- The interface speed after connect to target before/during reset & halt can be specified in the field Low speed marked below
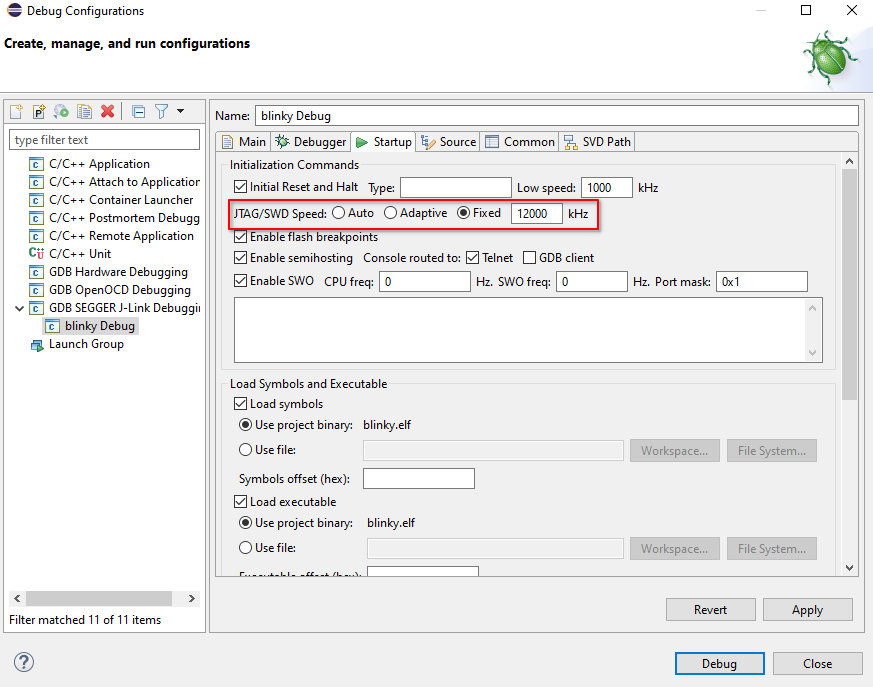
- Interface speed after initialization
- Open Run -> Debug Configurations...
- On the left side, select the used Debug configuration in the group GDB SEGGER J-Link Debugging
- Switch to the tab Startup
- The initial speed can be specified in the area JTAG/SWD Speed marked below


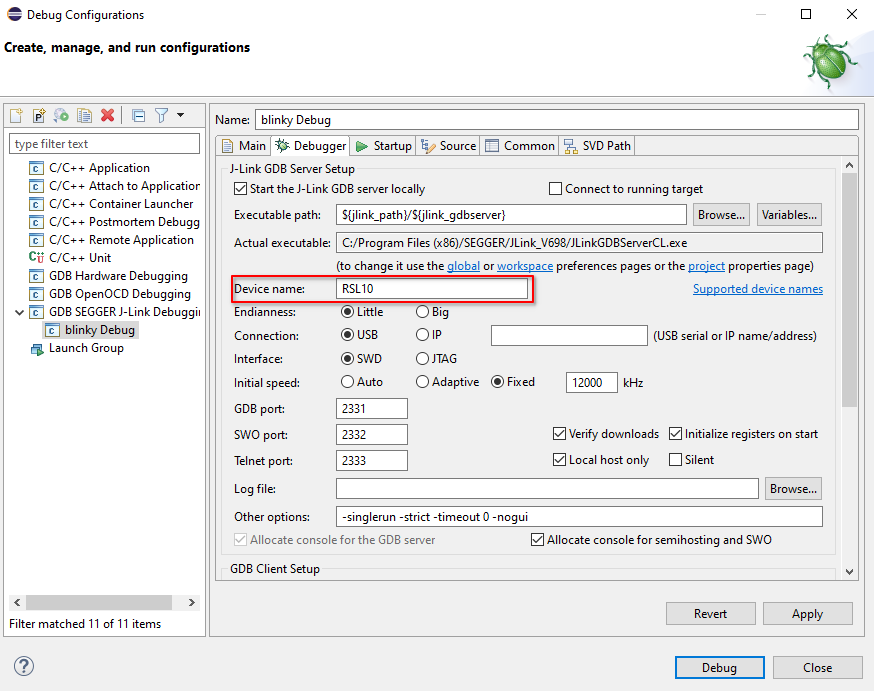
Specifying the target device
- Open Run -> Debug Configurations...
- On the left side, select the used Debug configuration in the group GDB SEGGER J-Link Debugging
- Switch to the tab Debugger
- The target device can be specified in the field Device name: marked below

Specifying J-Link GDB Server commandline options
For a list of available commandline options, please refer to UM08001. Commandline options for GDB Server can used for various J-Link features, e.g.
- specifying a J-Link Settings file
- specifying a J-Link script file
- specifying a J-Link Command String
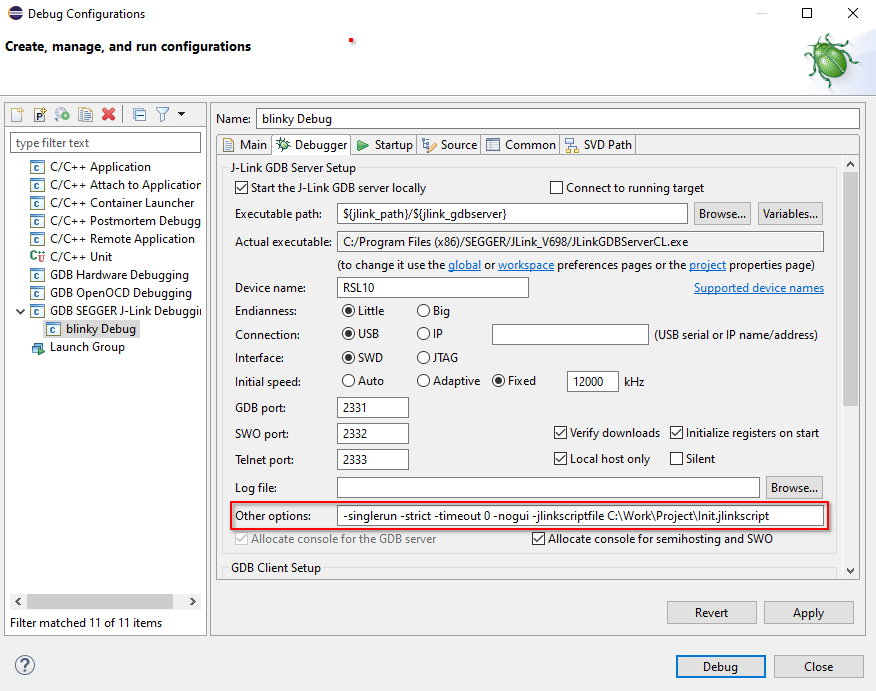
Commandline options can be specified by editing the field Other options:
- Open Run -> Debug Configurations...
- On the left side, select the used Debug configuration in the group GDB SEGGER J-Link Debugging
- Switch to the tab Debugger
- Commandline options can be specified by editing the field Other options marked below

J-Link Settings File
Please refer to Specifying J-Link GDB Server commandline options
Using J-Link Command Strings
Please refer to Specifying J-Link GDB Server commandline options
Please note that J-Link Command Strings can also be executed from J-Link script files.
Using J-Link script files
Please refer to Specifying J-Link GDB Server commandline options
Connecting to J-Link via J-Link Remote Server
The J-Link Remote Server makes it possible for On Semiconductor IDE/ GDB to connect to a J-Link remotely, without needing a physical connection to the J-Link.
In order to connect to a J-Link Remote Server using On Semiconductor IDE/ GDB follow these instructions:
- Make sure that a J-Link Debug Configuration is already created, as described above
- Open Run -> Debug Configurations...
- Select a J-Link Debug Configuration under GDB SEGGER J-Link Debugging
- Select the Debugger tab
- For Connection select IP
- Edit the IP field:
- For a remote server running in LAN mode, enter "<RemoteServerIP>".
- For a remote server running in tunneling mode, enter "tunnel:<SN/Nickname>[:<Pasword>[:tunnelserver[:port]]]"
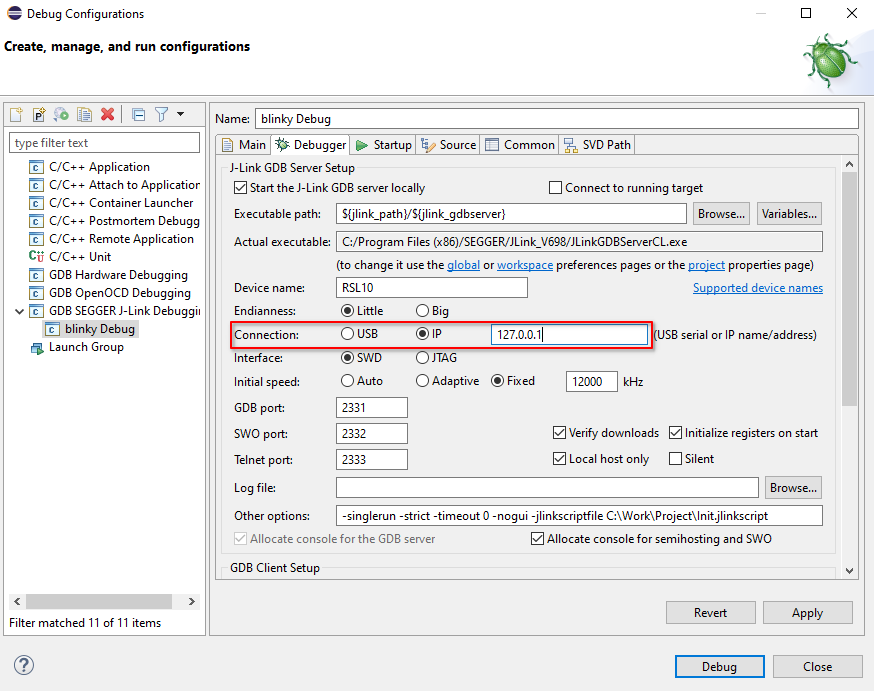
- Click Apply

Ready to Go
You can start debugging and use J-Link with On Semiconductor IDE.
