Difference between revisions of "SiFive Arty FPGA Dev Kit"
(→Debugging in FreedomStudio) |
(→Debugging in FreedomStudio) |
||
| Line 75: | Line 75: | ||
* Click on the arrow right next to the debug bug<br>[[File:FreedomStudio_Debug.png]] |
* Click on the arrow right next to the debug bug<br>[[File:FreedomStudio_Debug.png]] |
||
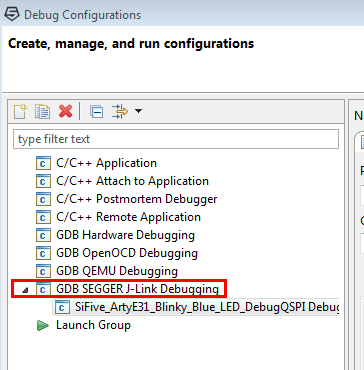
| + | * Double click on "GDB SEGGER J-Link Debugging"<br>[[File:FreedomStudio_NewDebugConfig.png]] |
||
| + | * Double click the newly generated configuration |
||
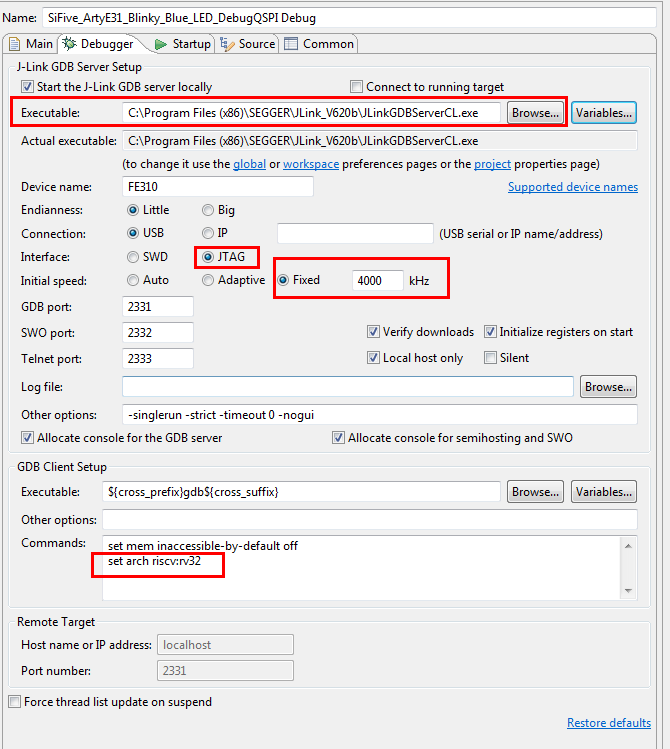
| + | * Click on the "Debugger" tab and make sure the settings look like below (the ones with the red border are non-default ones)<br>[[File:FreedomStudio_Debug_Debugger.png]] |
||
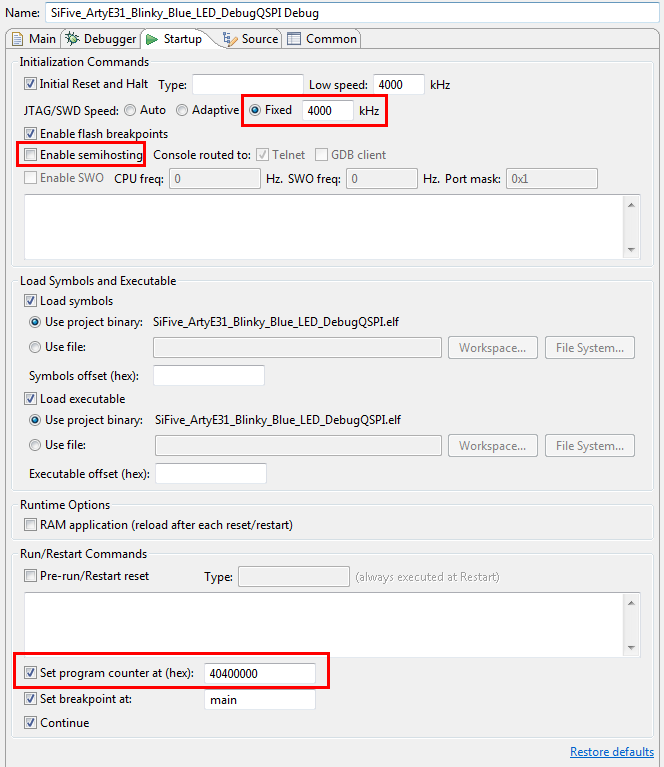
| + | * Click on the "Startup" tab and make sure the settings look like below (the ones with the red border are non-default ones)<br>[[File:FreedomStudio_Debug_Startup.png]] |
||
| + | === Set program counter at === |
||
| − | |||
| + | When debugging in QSPI, this option can be disabled. When debugging in RAM, it should point to the base address of region marked as executable (x) in the linker file. (Usually 0x80000000 for RAM projects) |
||
| − | Pics: |
||
| − | |||
| − | |||
| − | [[File:FreedomStudio_Debug_Debugger.png]] |
||
| − | [[File:FreedomStudio_Debug_Startup.png]] |
||
| − | [[File:FreedomStudio_NewDebugConfig.png]] |
||
| − | |||
| − | |||
| − | TBD |
||
== Example projects for FreedomStudio == |
== Example projects for FreedomStudio == |
||
Revision as of 15:54, 26 September 2017
Contents
This article describes specifics for the SiFive Arty FPGA Dev Kit.
Preparing for J-Link
The SiFive Arty FPGA Dev Kit does not come with a standard debug connector but populates the debug JTAG signals on a custom connector. Therefore, it needs to be manually wired in case J-Link shall be connected to it.
In the following, it is described how the pins of connector JD on the ARTY board needs to be wired to J-Link. All pins of the J-Link side refer to the standard 0.1" 20-pin connector of J-Link.
| Pin ARTY | Pin J-Link | Description |
|---|---|---|
| 1 | 13 | TDO |
| 2 | 3 | nTRST |
| 3 | 9 | TCK |
| 7 | 5 | TDI |
| 8 | 7 | TMS |
| 9 | 15 | nRESET |
| 11 | 4 | GND |
| 12 | 1 | VTref |
Note: The pins on the JD connector are numbered as follows:
| 6 | 5 | 4 | 3 | 2 | 1 |
| 12 | 11 | 10 | 9 | 8 | 7 |

Debugging in FreedomStudio
Before continuing, make sure that you have J-Link software package V6.20c or later installed: Download J-Link software package
In the following, the procedure how to setup a J-Link debug session in SiFive FreedomStudio is described. This tutorial assumes that there is already a compiling project present in FreedomStudio. If not, please find a selection of example projects here: XXXXXXXXXXXXXXXXXXXXXXXXXXXXXX
- Click on the arrow right next to the debug bug
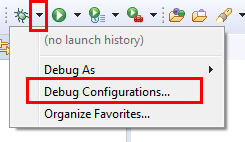
- Double click on "GDB SEGGER J-Link Debugging"
- Double click the newly generated configuration
- Click on the "Debugger" tab and make sure the settings look like below (the ones with the red border are non-default ones)
- Click on the "Startup" tab and make sure the settings look like below (the ones with the red border are non-default ones)


Set program counter at
When debugging in QSPI, this option can be disabled. When debugging in RAM, it should point to the base address of region marked as executable (x) in the linker file. (Usually 0x80000000 for RAM projects)
Example projects for FreedomStudio
TBD