Difference between revisions of "Tracing on Atmel ATSAME70"
(→Streaming trace) |
|||
| Line 4: | Line 4: | ||
The ATMEL ATSAME70 MCU implements tracing via pins, so a J-Trace can be used for tracing. |
The ATMEL ATSAME70 MCU implements tracing via pins, so a J-Trace can be used for tracing. |
||
| − | = Minimum requirements = |
+ | == Minimum requirements == |
In order to use trace on the ATMEL ATSAME70 devices, the following minimum requirements have to be met: |
In order to use trace on the ATMEL ATSAME70 devices, the following minimum requirements have to be met: |
||
* J-Link software version V6.22d or later |
* J-Link software version V6.22d or later |
||
| Line 10: | Line 10: | ||
* J-Trace PRO for Cortex-M HW version V1.0 or later |
* J-Trace PRO for Cortex-M HW version V1.0 or later |
||
| − | = Sample project = |
+ | == Sample project == |
| − | == Streaming trace == |
+ | === Streaming trace === |
The following sample project is designed to be used with J-Trace PRO and Ozone to demonstrate streaming trace. The project has been tested with the minimum requirements mentioned above and a Smart SAME70 Xplained evalboard. The sample project comes with a pre-configured project file for Ozone that runs out-of-the box. In order to rebuild the sample project, [https://www.segger.com/embedded-studio.html SEGGER Embedded Studio] can be used. |
The following sample project is designed to be used with J-Trace PRO and Ozone to demonstrate streaming trace. The project has been tested with the minimum requirements mentioned above and a Smart SAME70 Xplained evalboard. The sample project comes with a pre-configured project file for Ozone that runs out-of-the box. In order to rebuild the sample project, [https://www.segger.com/embedded-studio.html SEGGER Embedded Studio] can be used. |
||
| Line 20: | Line 20: | ||
To create your own .JLinkScriptfile you can use the following project as reference: [https://wiki.segger.com/Tracing_on_ST_STM32F407_(SEGGER_Cortex-M_Trace_Reference_Board) Tracing on SEGGER_Cortex-M_Trace_Reference_Board] |
To create your own .JLinkScriptfile you can use the following project as reference: [https://wiki.segger.com/Tracing_on_ST_STM32F407_(SEGGER_Cortex-M_Trace_Reference_Board) Tracing on SEGGER_Cortex-M_Trace_Reference_Board] |
||
| − | = Specifics/Limitations = |
+ | == Specifics/Limitations == |
The Smart SAME70 Xplained evalboard is sharing its ETM port with the on board Ethernet controller. This leads to interference on the trace signals. Ethernet and ETM Trace can't be used at the same time with this eval board. |
The Smart SAME70 Xplained evalboard is sharing its ETM port with the on board Ethernet controller. This leads to interference on the trace signals. Ethernet and ETM Trace can't be used at the same time with this eval board. |
||
Additionally the ATSAME70Q21 MCU used in this example has two watchdogs running from reset which need to be either disabled or fed regularly. |
Additionally the ATSAME70Q21 MCU used in this example has two watchdogs running from reset which need to be either disabled or fed regularly. |
||
| − | = Tested Hardware = |
+ | == Tested Hardware == |
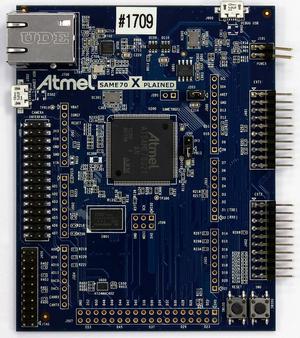
[[File:SAME70_XPlained.jpg|none|thumb|Smart SAME70 Xplained]] |
[[File:SAME70_XPlained.jpg|none|thumb|Smart SAME70 Xplained]] |
||
| − | = Reference trace signal quality = |
+ | == Reference trace signal quality == |
The following pictures show oscilloscope measurements of trace signals output by the "Tested Hardware" using the example project. |
The following pictures show oscilloscope measurements of trace signals output by the "Tested Hardware" using the example project. |
||
All measurements have been performed using a Agilent InfiniiVision DSO7034B 350 MHz 2GSa/s oscilloscope and 1156A 1.5 GHz Active Probes. If your trace signals look similar on your trace hardware, chances are good that tracing will work out-of-the-box using the example project. |
All measurements have been performed using a Agilent InfiniiVision DSO7034B 350 MHz 2GSa/s oscilloscope and 1156A 1.5 GHz Active Probes. If your trace signals look similar on your trace hardware, chances are good that tracing will work out-of-the-box using the example project. |
||
More information about correct trace timing can be found at the following [https://www.segger.com/products/debug-probes/j-trace/technology/setting-up-trace/ website]. |
More information about correct trace timing can be found at the following [https://www.segger.com/products/debug-probes/j-trace/technology/setting-up-trace/ website]. |
||
| − | == Rise time == |
+ | === Rise time === |
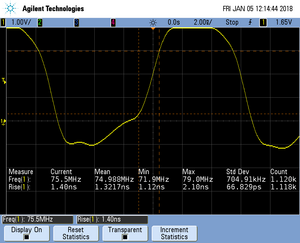
The rise time of a signal shows the time needed for a signal to rise from logical 0 to logical 1. For this the values at 10% and 90% of the expected voltage level get used as markers. The following picture shows such a measurement for the trace clock signal. |
The rise time of a signal shows the time needed for a signal to rise from logical 0 to logical 1. For this the values at 10% and 90% of the expected voltage level get used as markers. The following picture shows such a measurement for the trace clock signal. |
||
[[File:SAME70_Risetime_TCLK.png|none|thumb|TCLK rise time]] |
[[File:SAME70_Risetime_TCLK.png|none|thumb|TCLK rise time]] |
||
| − | == Setup time == |
+ | === Setup time === |
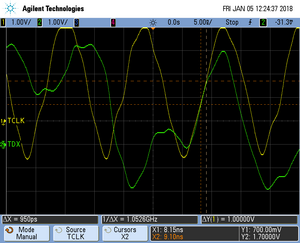
The setup time shows the relative setup time between a trace data signal and trace clock. The measurement markers are set at 50% of the expected voltage level respectively. The following picture shows such a measurement for the trace data signal 0 relative to the trace clock signal. |
The setup time shows the relative setup time between a trace data signal and trace clock. The measurement markers are set at 50% of the expected voltage level respectively. The following picture shows such a measurement for the trace data signal 0 relative to the trace clock signal. |
||
[[File:SAME70_Setuptime_TD0.png|none|thumb|TD0 setup time]] |
[[File:SAME70_Setuptime_TD0.png|none|thumb|TD0 setup time]] |
||
Revision as of 17:40, 13 November 2020
Contents
This article describes how to get started with trace on the ATMEL ATSAME70 MCU. This article assumes that there is already a basic knowledge about trace in general (what is trace, what different implementations of trace are there, etc.). If this is not the case, we recommend to read Trace chapter in the J-Link User Manual (UM08001). The ATMEL ATSAME70 MCU implements tracing via pins, so a J-Trace can be used for tracing.
Minimum requirements
In order to use trace on the ATMEL ATSAME70 devices, the following minimum requirements have to be met:
- J-Link software version V6.22d or later
- Ozone V2.54b or later (if streaming trace and / or the sample project from below shall be used)
- J-Trace PRO for Cortex-M HW version V1.0 or later
Sample project
Streaming trace
The following sample project is designed to be used with J-Trace PRO and Ozone to demonstrate streaming trace. The project has been tested with the minimum requirements mentioned above and a Smart SAME70 Xplained evalboard. The sample project comes with a pre-configured project file for Ozone that runs out-of-the box. In order to rebuild the sample project, SEGGER Embedded Studio can be used.
Atmel_ATSAME70_75MHz_Trace.zip
Note: The example is shipped with a compiled .JLinkScriptfile, should you need the original source, please get in touch with SEGGER directly via our support system: https://www.segger.com/ticket/.
To create your own .JLinkScriptfile you can use the following project as reference: Tracing on SEGGER_Cortex-M_Trace_Reference_Board
Specifics/Limitations
The Smart SAME70 Xplained evalboard is sharing its ETM port with the on board Ethernet controller. This leads to interference on the trace signals. Ethernet and ETM Trace can't be used at the same time with this eval board. Additionally the ATSAME70Q21 MCU used in this example has two watchdogs running from reset which need to be either disabled or fed regularly.
Tested Hardware
Reference trace signal quality
The following pictures show oscilloscope measurements of trace signals output by the "Tested Hardware" using the example project. All measurements have been performed using a Agilent InfiniiVision DSO7034B 350 MHz 2GSa/s oscilloscope and 1156A 1.5 GHz Active Probes. If your trace signals look similar on your trace hardware, chances are good that tracing will work out-of-the-box using the example project. More information about correct trace timing can be found at the following website.
Rise time
The rise time of a signal shows the time needed for a signal to rise from logical 0 to logical 1. For this the values at 10% and 90% of the expected voltage level get used as markers. The following picture shows such a measurement for the trace clock signal.
Setup time
The setup time shows the relative setup time between a trace data signal and trace clock. The measurement markers are set at 50% of the expected voltage level respectively. The following picture shows such a measurement for the trace data signal 0 relative to the trace clock signal.


