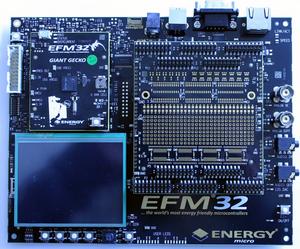
Tracing on Silicon Labs EFM32GG990
Contents
This article describes how to get started with trace on the Silicon Labs EFM32GG990 MCU. This article assumes that there is already a basic knowledge about trace in general (what is trace, what different implementations of trace are there, etc.). If this is not the case, we recommend to read Trace chapter in the J-Link User Manual (UM08001). The Silicon Labs EFM32GG990 MCU implements tracing via pins , so a J-Trace can be used for tracing.
Minimum requirements
In order to use trace on the Silicon Labs EFM32GG990 devices, the following minimum requirements have to be met:
- J-Link software version V6.20f or later
- Ozone V2.50c or later (if streaming trace and / or the sample project from below shall be used)
- J-Trace PRO for Cortex-M HW version V1.0 or later
Sample project
Streaming trace
The following sample project is designed to be used with J-Trace PRO and Ozone to demonstrate streaming trace. The project has been tested with the minimum requirements mentioned above and a EFM32GG-DK3750 evaluation board. The sample project comes with a pre-configured project file for Ozone that runs out-of-the box. Please note that this particular needs additional hardware settings to enable external trace probes, see section Specifics/Limitations. In order to rebuild the sample project, SEGGER Embedded Studio can be used.
SiliconLabs_EFM32GG990_7MHz_TraceExample.zip
Note: The example is shipped with a compiled .JLinkScriptfile, should you need the original source it can be requested at support@segger.com
To create your own .JLinkScriptfile you can use the following project as reference: Tracing on SEGGER_Cortex-M_Trace_Reference_Board
Specifics/Limitations
The EFM32GG-DK3750 evaluation board comes with a development kit user interface consisting of the TFT-LCD display together with the buttons PB1 to PB4 and the 5-way joystick located below. This interface needs to be used to enable ETM trace and external debug probes. Per default the evaluation board is set to use the internal J-Trace OB. To enable streaming trace on your external J-Trace PRO folow these steps:
- Press button PB2 below the menu point "CFG"
- Navigate to the entry "Debug Control" with the joystick and select "IN"
- Navigate to the entry "ETM Trace" with the joystick and select "ON"
- Press PB4 ("Save") to save this settings
- Press PB1 ("Back") twice to return to the main screen
- If everything was successfull in the top left corner it should read "Debug: TRACE IN"
For more information see the "Development Kit EFM32GG-DK3750" user manual.
