Difference between revisions of "Eclipse"
(Created page with "Eclipse is a universal customizable IDE, which is also the base for many common commercial IDEs. In order to work with Eclipse and debug with J-Link, you also need to install...") |
|||
| Line 75: | Line 75: | ||
* specifying a J-Link Settings file |
* specifying a J-Link Settings file |
||
* specifying a J-Link script file |
* specifying a J-Link script file |
||
| − | * specifying a J-Link |
+ | * specifying a J-Link Command String |
Commandline options can be specified by editing the field '''Other options''': |
Commandline options can be specified by editing the field '''Other options''': |
||
| Line 90: | Line 90: | ||
| − | === Using J-Link |
+ | === Using J-Link Command Strings === |
Please refer to [[Eclipse#Specifying J-Link GDB Server commandline options | Specifying J-Link GDB Server commandline options]]<br> |
Please refer to [[Eclipse#Specifying J-Link GDB Server commandline options | Specifying J-Link GDB Server commandline options]]<br> |
||
| − | Please note that J-Link |
+ | Please note that J-Link Command Strings can also be executed from J-Link script files. |
Revision as of 12:28, 24 January 2018
Eclipse is a universal customizable IDE, which is also the base for many common commercial IDEs. In order to work with Eclipse and debug with J-Link, you also need to install a toolchain which includes compiler, assembler, linker + GDB (GNU Debugger) for debugging (e.g. GNU Tools for ARM). Moreover, in order to allow hardware debugging on embedded systems via GDB + GDB Server, there is also an Eclipse plugin needed, which enables hardware debugging via GDB (e.g. the CDT plugin). After setting up Eclipse + Plugin, Eclipse will use GDB as debugger where GDB communicates via the GDB protocol with J-Link GDB Server, allowing to debug the target hardware which is connected to a J-Link.
The tutorials in this article are based on Eclipse Neon.3 setup with the GNU ARM Eclipse environment by following the official install instructions. The GNU ARM Eclipse project is a collection of plug-ins for Eclipse CDT and ARM toolchains including extensions for easy embedded development in Eclipse. It is recommended to use this plug-in when working with a standard Eclipse installation.
Note: J-Link GDB Server is part of the J-Link Software and Documentation Pack and can be used free of charge.
Contents
- 1 Getting started
- 1.1 Creating a J-Link Debug Configuration
- 1.2 Configuring the target interface type
- 1.3 Configuring the target interface speed
- 1.4 Specifying the target device
- 1.5 Specifying J-Link GDB Server commandline options
- 1.6 J-Link Settings File
- 1.7 Using J-Link Command Strings
- 1.8 Using J-Link script files
Getting started
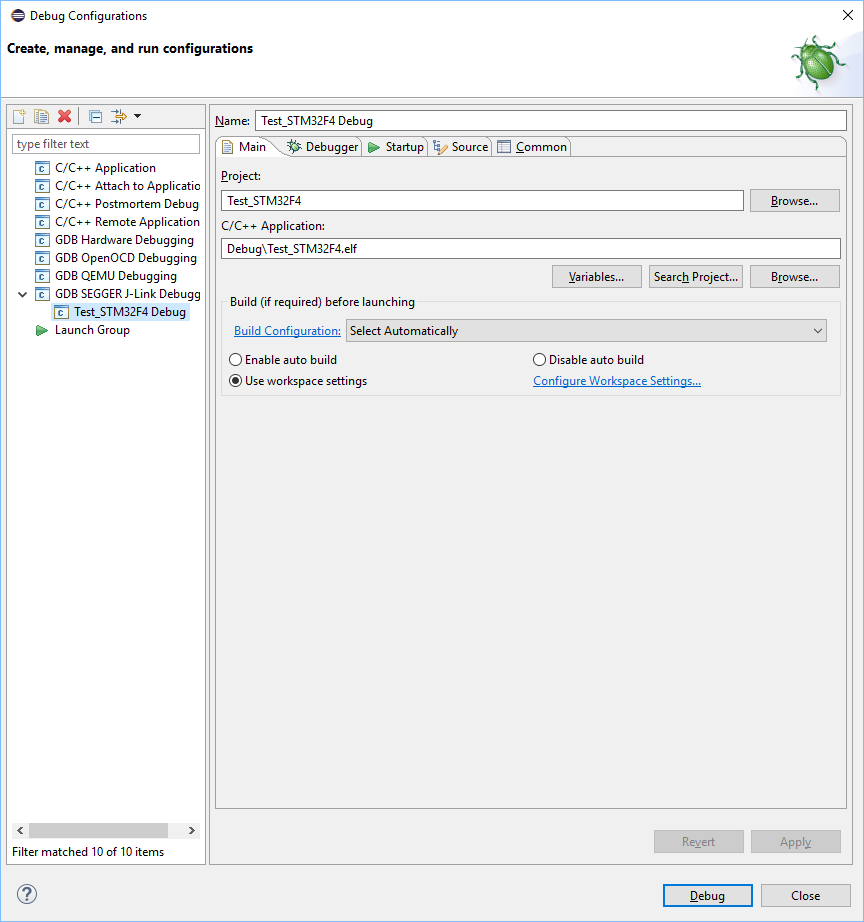
Creating a J-Link Debug Configuration
- Open Run -> Debug Configurations...
- Double click GDB SEGGER J-Link Debugging
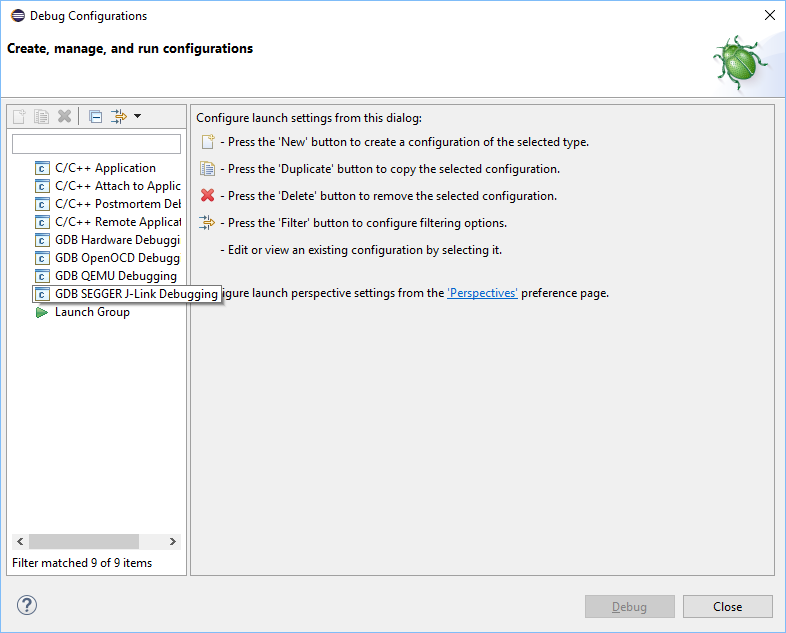
- Eclipse will create a New Debug Configuration and set setting to defaults based on the workspace and project


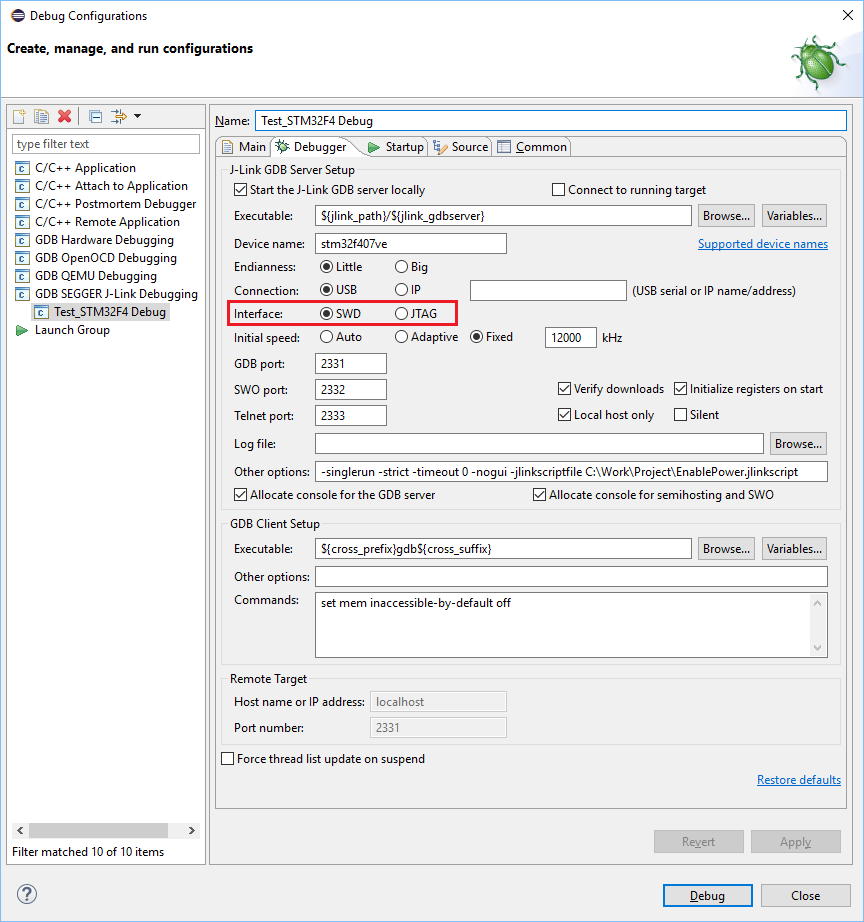
Configuring the target interface type
- Open Run -> Debug Configurations...
- On the left side, select the used Debug configuration in the group GDB SEGGER J-Link Debugging
- Switch to the tab Debugger
- The target interface can be selected in the area marked below

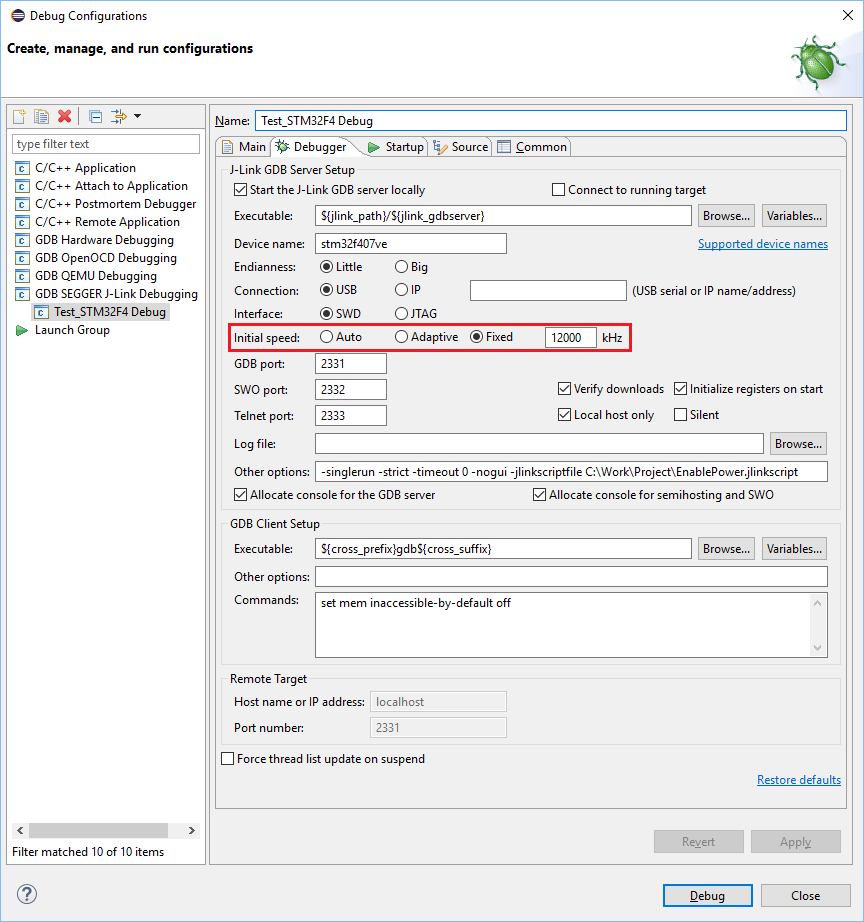
Configuring the target interface speed
- Initial interface speed before/during connect
- Open Run -> Debug Configurations...
- On the left side, select the used Debug configuration in the group GDB SEGGER J-Link Debugging
- Switch to the tab Debugger
- The interface speed before connect can be specified in the field Initial speed marked below
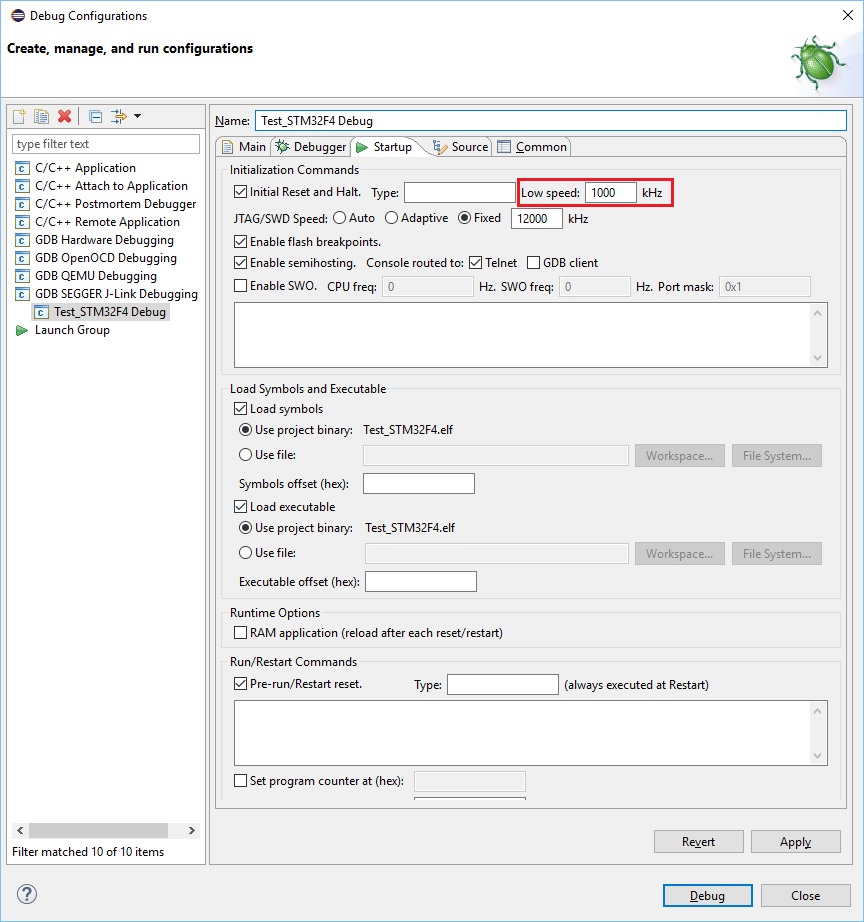
- Interface speed after connect to target before/during reset & halt
- Open Run -> Debug Configurations...
- On the left side, select the used Debug configuration in the group GDB SEGGER J-Link Debugging
- Switch to the tab Startup
- The interface speed after connect to target before/during reset & halt can be specified in the field Low speed marked below
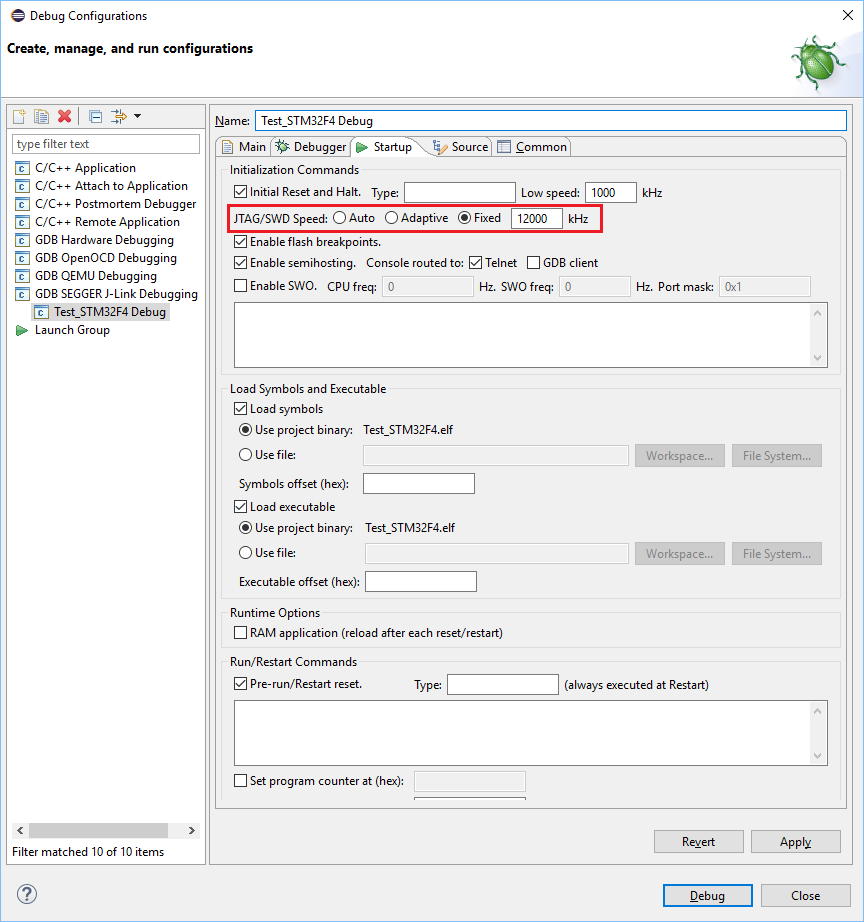
- Interface speed after initialization
- Open Run -> Debug Configurations...
- On the left side, select the used Debug configuration in the group GDB SEGGER J-Link Debugging
- Switch to the tab Startup
- The initial speed can be specified in the area JTAG/SWD Speed marked below


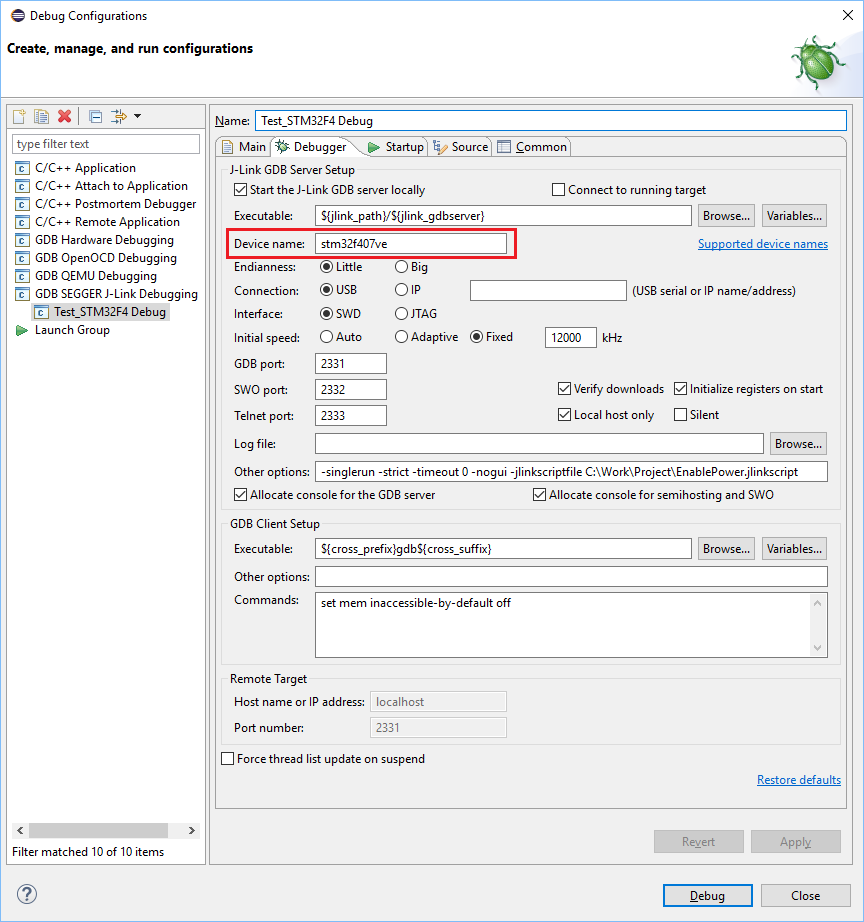
Specifying the target device
- Open Run -> Debug Configurations...
- On the left side, select the used Debug configuration in the group GDB SEGGER J-Link Debugging
- Switch to the tab Debugger
- The target device can be specified in the field Device name: marked below

Specifying J-Link GDB Server commandline options
For a list of available commandline options, please refer to UM08001. Commandline options for GDB Server can used for various J-Link features, e.g.
- specifying a J-Link Settings file
- specifying a J-Link script file
- specifying a J-Link Command String
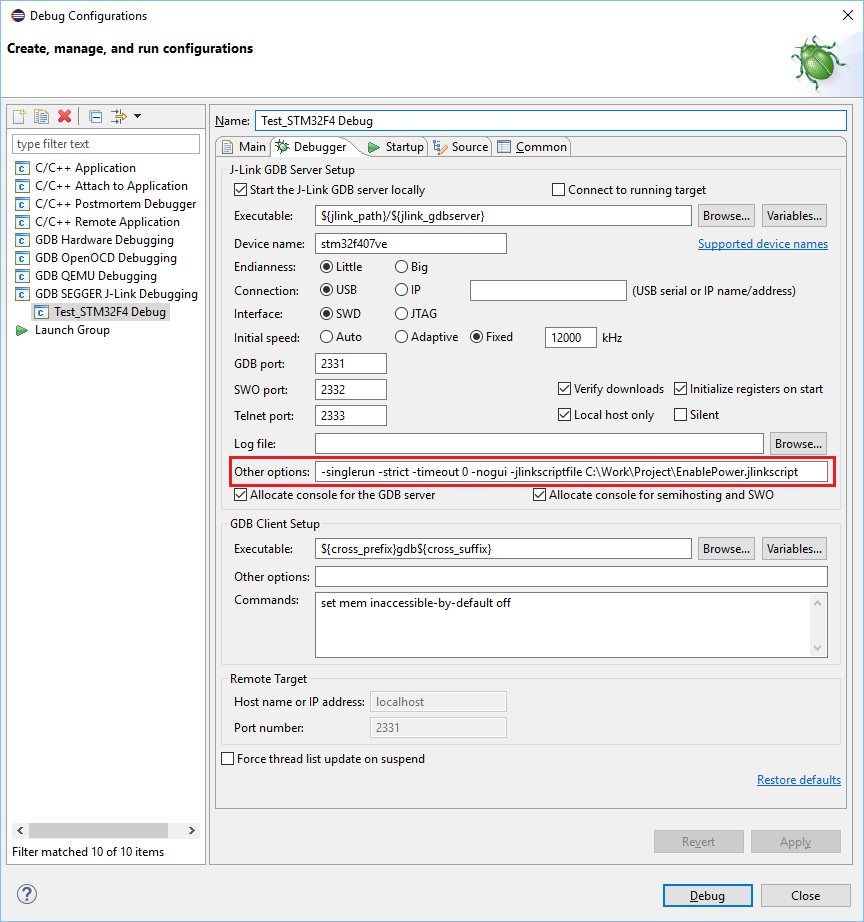
Commandline options can be specified by editing the field Other options:
- Open Run -> Debug Configurations...
- On the left side, select the used Debug configuration in the group GDB SEGGER J-Link Debugging
- Switch to the tab Debugger
- Commandline options can be specified by editing the field Other options marked below

J-Link Settings File
Please refer to Specifying J-Link GDB Server commandline options
Using J-Link Command Strings
Please refer to Specifying J-Link GDB Server commandline options
Please note that J-Link Command Strings can also be executed from J-Link script files.
Using J-Link script files
Please refer to Specifying J-Link GDB Server commandline options