IAR EWARM
IAR's EWARM is a J-Link compatible 3rd party IDE that supports most J-Link features out-of-the-box. We recommend to always install the latest J-Link software and documentation pack to make sure that EWARM uses the latest J-Link DLL.
Contents
Using J-Link with an existing project
In the following, it is explained how to configure a project to be used with J-Link.
Specifying the target device
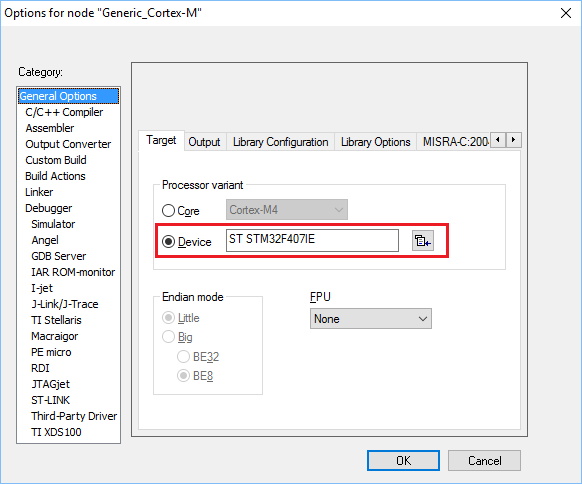
- Open the project to configure
- Open the project settings (ALT + F7)
- Go to General Options --> Target
- Make sure that the proper device is selected
If the target device used is not listed in EWARM, either a IAR device description file (.ddf) or the IDE independent way can be used.
For further information regarding .ddf files, please refer to the IAR documentation.
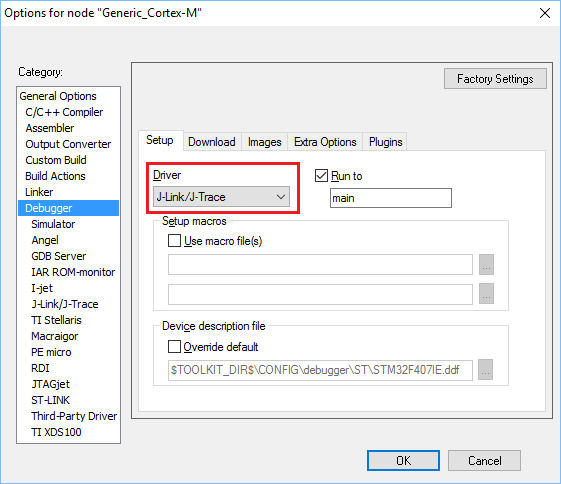
- Go to Debugger --> Setup and select J-Link/J-Trace in the Driver drop-down menu

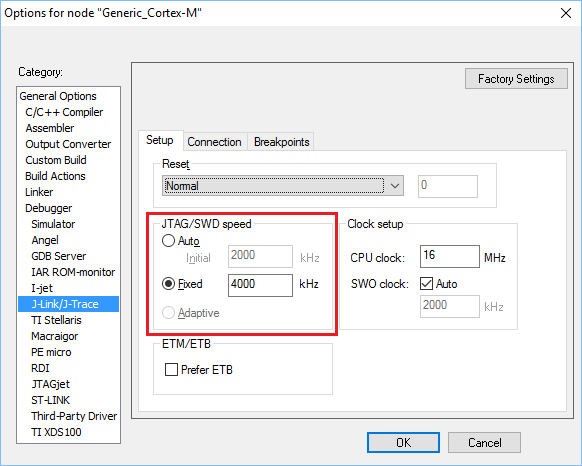
- Go to J-Link/J-Trace --> Setup
- Configure a proper target interface speed (fixed 4000 kHz is suitable for most targets and leads to good performance)

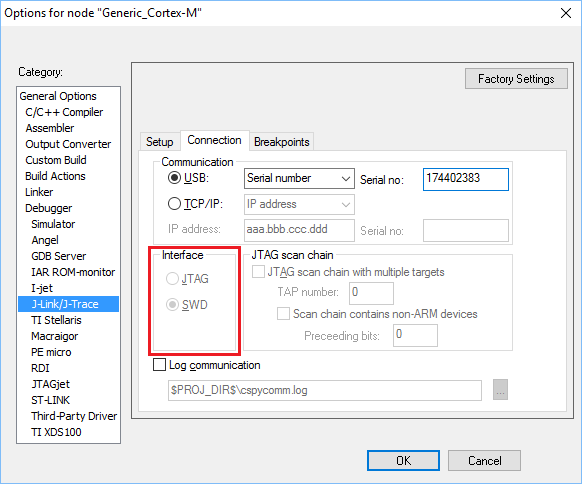
- Switch to the Connection tab
- Select the appropriate target interface in the Interface box

Using the J-Link Flash loader
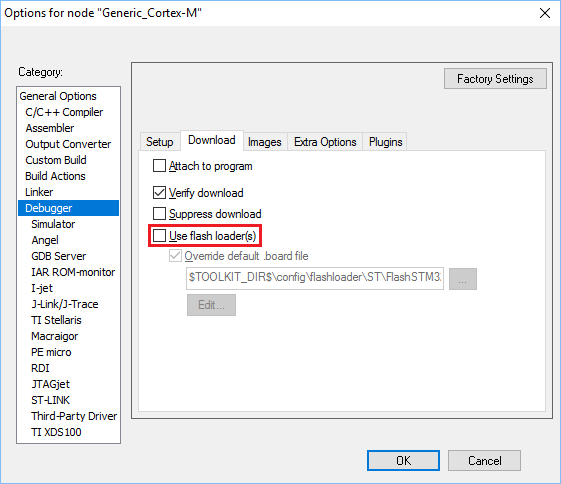
- Open the project settings (ALT + F7)
- Make sure appropriate target device is specified (Specifying the target device)
- Select Debugger in the list on the left site
- Select the tab Download
- Uncheck Use flash loader(s)

Using J-Link script files
IAR EWARM does not provide any native support for J-Link script files so usage of them cannot be configured from within the GUI of the IDE itself.
Anyhow, it is possible to use a J-Link script file by making use of the auto-search feature of the DLL:
- Copy the J-Link script file to folder where the J-Link settings file is located (see section "J-Link settings file" below)
- Rename the J-Link script to <ProjectName>_<DebugConfig>.JLinkScript. In the sample below, Start_STM32F103_MB672_Debug.JLinkScript would be correct.
J-Link settings file
Settings file with default settings is created on first start of a debug session. There is one settings file per build configuration for the project. Naming is:
<ProjectName>_<DebugConfig>.jlink
The settings file is created in a "settings" subdirectory where the project file is located.

RDI
Since IAR EWARM V5.30 J-Link is fully and natively supported by EWARM, so RDI is no longer needed.
In order to use J-Link RDI, the debug driver needs to be changed.
- Open the project settings (ALT + F7)
- Select Debugger in the list on the left site
- Select "RDI" in the Driver drop-down menu
- Select RDI in the list on the left site
- Select the tab RDI
- Select the manufacturer driver by navigating to the J-Link software installation directory, and select JLinkRDI.dll, then click OK
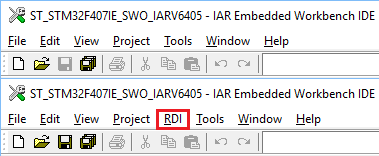
- Now an extra menu, RDI, has been added to the menu bar.
- Choose Configure in the RDI menu to configure J-Link RDI. For more information about the setup of J-Link RDI, please refer to UM08001.

Debugging on Cortex-M devices
The RDI protocol has only been specified by ARM for ARM 7/9 cores. For Cortex-M there is no official extension of the RDI protocol regarding the register assignement, that has been approved by ARM. Since IAR EWARM version 5.11 it is possible to use J-Link RDI for Cortex-M devices because SEGGER and IAR have come to an agreement regarding the RDI register assignment for Cortex-M. The following table lists the register assignment for RDI and Cortex-M:
| Register Index | Assigned register |
|---|---|
| 0 | R0 |
| 1 | R1 |
| 2 | R2 |
| 3 | R3 |
| 4 | R4 |
| 5 | R5 |
| 6 | R6 |
| 7 | R7 |
| 8 | R8 |
| 9 | R9 |
| 10 | R10 |
| 11 | R11 |
| 12 | R12 |
| 13 | MSP / PSP (depending on mode) |
| 14 | R14 (LR) |
| 16 | R15 (PC) |
| 17 | XPSR |
| 18 | APSR |
| 19 | IPSR |
| 20 | EPSR |
| 21 | IAPSR |
| 22 | EAPSR |
| 23 | IEPSR |
| 24 | PRIMASK |
| 25 | FAULTMASK |
| 26 | BASEPRI |
| 27 | BASEPRI_MAX |
| 28 | CFBP (CONTROL/FAULT/BASEPRI/PRIMASK) |
SWO
Enabling stdout redirection to SWO
It is possible to configure the IAR EWARM compiler so that stdout is redirected to SWO.
Connecting to a specific J-Link
If multiple J-Links are connected to the host PC and/or a J-Link connection via TCP/IP shall be used, either the IDE independent way can be used, or the S/N or IP of the respective J-Link can be specified in the IAR EWARM project settings.
In order to explicitly specify the J-Link to use,
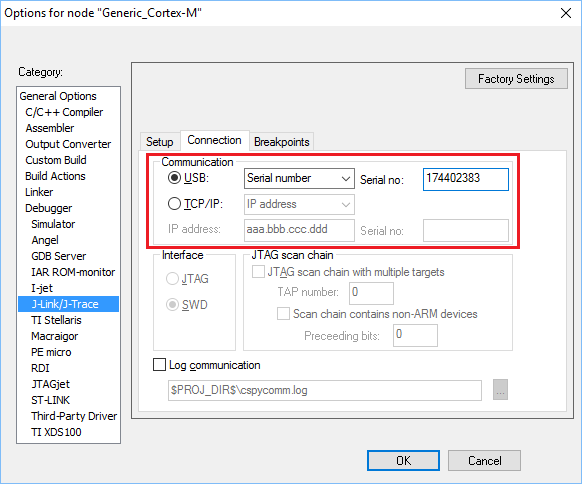
- Open the project settings (ALT + F7)
- Select J-Link/J-Trace in the list on the left site
- Select the tab Connection
- For USB:
- Select USB
- Select "Serial number" in the drop-down menu
- Enter the S/N in the field labeled Serial no:
- For IP:
- Select TCP/IP
- Select "IP address" in the drop-down menu
- Enter the IP address in the field labeled IP address:

Connecting to J-Link via J-Link Remote Server
The J-Link Remote Server makes it possible for IAR Embedded Workbench IDE to connect to a J-Link remotely, without needing a physical connection to the J-Link.
In order to use the J-Link Remote Server using IAR Embedded Workbench IDE, follow these instructions:
- Open the project to configure
- Configure the project to use J-Link/ J-Trace, as described above
- Open the project settings (ALT + F7)
- Go to J-Link/J-Trace --> Connections
- Select TCP_IP and choose IP address
- Set the IP address:
- For a remote server running in LAN mode, enter "<RemoteServerIP>".
- For a remote server running in tunneling mode, enter "tunnel:<SN/Nickname>[:<Pasword>[:tunnelserver[:port]]]"

- Click OK
From then on, the J-Link is handled the same as if it was connected directly via USB.
How to configure SWO for EWARM V8
With EWARM release version 8 some default project settings for SWO configuration with J-Link got changed and thus manual correction by the user is currently necessary. The following article will show a step by step guide how to set up SWO in an EWARM project and common troubleshooting tips to solve any issues a user might run into.
Setup Guide
- Open up an EWARMv8 project and make sure the correct target device is selected (in case of the emPower board it is the NXP MK66FN2M0xxx18).

- Next change the project settings to use SWO instead of Semihosting (If SWO is greyed out, go to J-Link/J-Trace -> Interface and select SWD as interface).

- Make sure J-Link/J-Trace is selected as debug hardware.

- Enter CPU clock speed value in the EWARM project settings and set SWO clock to "Auto". CPU clock speed represents the speed at the point where the target system has been fully initialized (PLLs are running and clock source has been switched to PLL etc.)

- Now start the debug session and open the Terminal I/O window under View-> Terminal I/O, the printf output will now be displayed in that window.

A basic EWARMv8 project for the emPower board with all settings applied can be found here: SEGGER_emPower_SWO_EWARMv8.zip
Troubleshooting
- The Terminal I/O windows is still not showing any information even after following the setup guide step by step.
- Make sure the SWO pin is actually connected to your J-Link debug hardware, many J-Link OBs for example do not have SWO routed to them.
- Check if the selected target device is correct.
- Create a testloop in your application where repeatedly prinf is called and see if that message is displayed in the J-Link SWO Viewer, if this is the case then the EWARM project settings are still incorrect.
- I want SWO to output PC and timestamps.
- To do so you need a running debug session, now go to J-Link->SWO Trace, press the "On" button in the now open window, then go to J-Link->SWO Trace Window Settings... and select all advance SWO features you want to monitor in the SWO Trace window.

- I am getting OVERFLOW packages, what should i do?
- When outputting large amounts of SWO trace data the SWO clock must be increased as well so the target device is able to output all generated SWO data. In addition to this a capable debug probe is needed. A J-Link model overview can be found here: J-Link Model Overview. For the best SWO trace experience we recommend a J-Link ULTRA+ or higher.
- I want to use SWO and JTAG simultaniously, how can i do that?
- This is not possible as the TDO (JTAG) signal is sharing the same pin as SWO. To be able to use SWO a SWD debug connection is required.
- I can't start a debug session
- Is the target device powered properly? You can open the J-Link Commander to see what voltage is currently showing as VTREF in the console output. Is that value expected?
- Try to use the J-Link flash loader to program the target device instead. To do that simply uncheck the following option in project settings.

If there are still issues persisting, please get in touch with SEGGER directly via our support system: https://www.segger.com/ticket/.