Configure instruction trace in Embedded Studio
Revision as of 16:17, 28 May 2020 by Fabian (talk | contribs) (Fabian moved page Configure ETB Trace in Embedded Studio to Configure instruction trace in Embedded Studio: Expanded article)
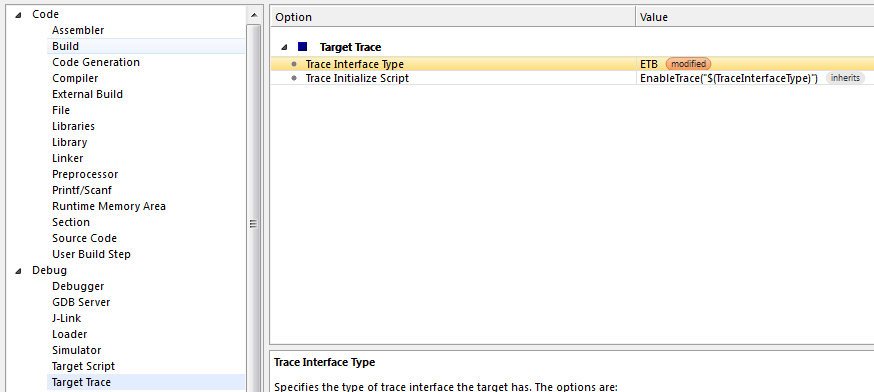
In general, to get ETB up and running, just make sure to configure ETB as Trace Interface Type in the Embedded Studio project settings:
Debugger --> Target Trace Options --> Trace Interface Type --> ETB
Once the debug session has been started, the most recent executed instructions will be shown in the instruction backtrace window. The window can be opened at:
Debug --> Other windows --> Execution Trace
File:ES ExecutionTrace ETB.png
ETB trace on NXP TWR-K65F
ETB trace with the OpenSDA on-board which is on the NXP TWR-K65F board and for which SEGGER also provide a firmware. Further information regarding the J-Link OpenSDA firmware can be found on the SEGGER webpage: https://www.segger.com/opensda.html.
Below a sample project that is already prepared for ETB trace on the K65 is available for download.
