Difference between revisions of "How to configure Embedded Studio to use SWO"
(Created page with "SEGGER's Embedded Studio offers advanced SWO code profiling like execution trace and execution profiling. This article will cover a basic setup for Embedded Studio that can be...") |
|
(No difference)
| |
Revision as of 14:46, 31 August 2017
SEGGER's Embedded Studio offers advanced SWO code profiling like execution trace and execution profiling. This article will cover a basic setup for Embedded Studio that can be transferred to any supported target device with a connected SWO pin.
Example Setup
The setup guide will be based on the following hardware and software components:
- J-Link Software Package V6.18c or later
- Embedded Studio V3.26a or later
- SEGGER emPower evaluation board
- Any J-Link/J-Trace hardware
- Physically connected SWO pin to debug interface
Setup Guide
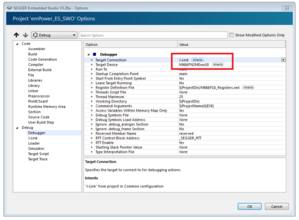
- Open up or create a new ES project and make sure the correct target device is selected (in case of the emPower board it is the NXP MK66FN2M0xxx18) and J-Link is selected as the Target Connection device by opening the project options.
- Download the application once into the target by starting the debug session to make sure all PLL settings are applied before the next step.
- Detect actual SWO clock speed by using SEGGER's J-Link SWO Viewer for example, make sure that at this point your target application has been downloaded once so all PLL settings have been applied. To measure the SWO clock speed first close all open connections to J-Link, open SWO viewer, select your device and press measure.
File:4Measure SWO Clock.PNG
Measure SWO clock
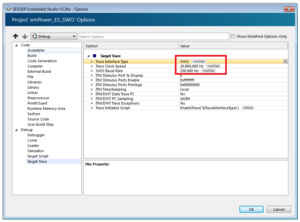
- Take the measured value and enable SWO in the ES project settings, make sure the trace clock speed is set to a correct value and the
SWO baud rate is set to a supported value. In this case the J-Link OB is limited to a baud rate of 250 kHz but any external J-Link device is capable of handling 2 MHz and higher.
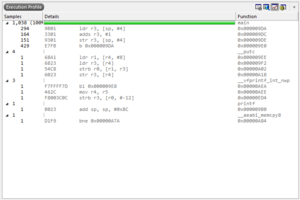
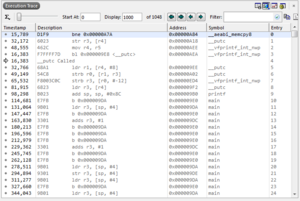
- Confirm the selection and start a debug session. To make the advanced code profiling features visible open the corresponding windows under View>More Debug Windows>Execution Profile and View>More Debug Windows>Execution Trace.
A basic ES project for the emPower board with all settings applied can be found here: emPower_ES_SWO.zip
Troubleshooting
- The Terminal I/O windows is still not showing any information even after following the setup guide step by step.
- Make sure the SWO pin is actually connected to your J-Link debug hardware, many J-Link OBs for example do not have SWO routed to them.
- Check if the selected target device is correct.
- I want to use SWO and JTAG simultaniously, how can i do that?
- This is not possible as the TDO (JTAG) signal is sharing the same pin as SWO. To be able to use SWO a SWD debug connection is required.
- I can't start a debug session
- Is the target device powered properly? You can open the J-Link Commander to see what voltage is currently showing as VTREF in the console output. Is that value expected?
If there are still issues persisting feel free to contact our support: support@segger.com


