SEGGER Embedded Studio
Embedded Studio is a complete all-in-one solution for managing, building, testing and deploying your embedded applications: From the Project Generator which gets you easily started with common ARM microcontrollers, to the powerful Project Manager and source code Editor, the included C/C++ Compiler and the integrated Debugger with advanced debug information windows and direct J-Link integration, right through to version control features for automatic deployment of your applications.
Embedded Studio is based on Rowley's professional IDE - CrossWorks. Its Visual Studio-like style offers the embedded world of engineering the same intuitive usage that PC developers are familiar with.
ETB trace on NXP TWR-K65F
Embedded Studio is a complete all-in-one solution for managing, building, testing and deploying your embedded applications: From the Project Generator which gets you easily started with common ARM microcontrollers, to the powerful Project Manager and source code Editor, the included C/C++ Compiler and the integrated Debugger with advanced debug information windows and direct J-Link integration, right through to version control features for automatic deployment of your applications.
Embedded Studio is based on Rowley's professional IDE - CrossWorks. Its Visual Studio-like style offers the embedded world of engineering the same intuitive usage that PC developers are familiar with.
Contents
- 1 ETB trace on NXP TWR-K65F
- 2 ETB trace on NXP TWR-K65F
- 3 How to port projects from IAR EWARM to SEGGER Embedded Studio
- 4 How to configure Embedded Studio to use SWO
- 5 Embedded Studio VCS configuration
- 6 Embedded Studio installation on newer Linux versions
- 7 How to enable RTOS thread awareness
- 8 How to place a function in RAM
- 9 How to use an external toolchain with Embedded Studio
ETB trace on NXP TWR-K65F
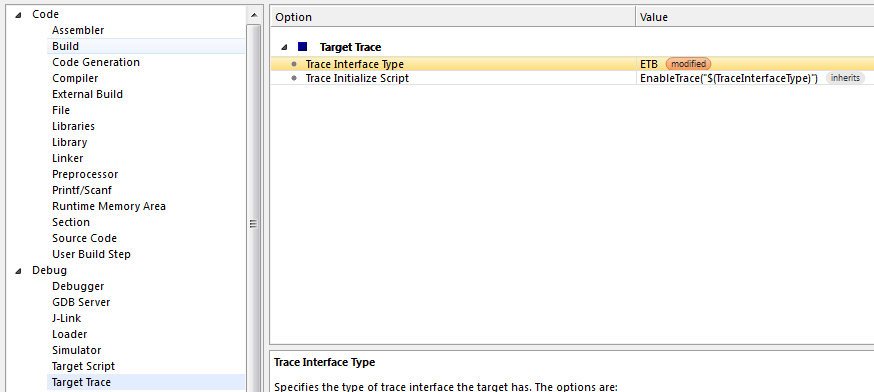
ETB trace with the OpenSDA on-board which is on the NXP TWR-K65F board and for which SEGGER also provide a firmware. Further information regarding the J-Link OpenSDA firmware can be found on the SEGGER webpage: https://www.segger.com/opensda.html. In general, to get ETB up and running, just make sure to configure ETB as Trace Interface Type in the Embedded Studio project settings:
Debugger --> Target Trace Options --> Trace Interface Type --> ETB
Once the debug session has been started, the most recent executed instructions will be shown in the instruction backtrace window. The window can be opened at:
Debug --> Other windows --> Execution Trace
File:ES ExecutionTrace ETB.png
Below a sample project that is already prepared for ETB trace on the K65 is available for download.
