Difference between revisions of "Atollic TrueSTUDIO"
| Line 8: | Line 8: | ||
= Using J-Link Command Strings = |
= Using J-Link Command Strings = |
||
* [[File:Eclipse_JLinkDebugConfDefault.png]] |
* [[File:Eclipse_JLinkDebugConfDefault.png]] |
||
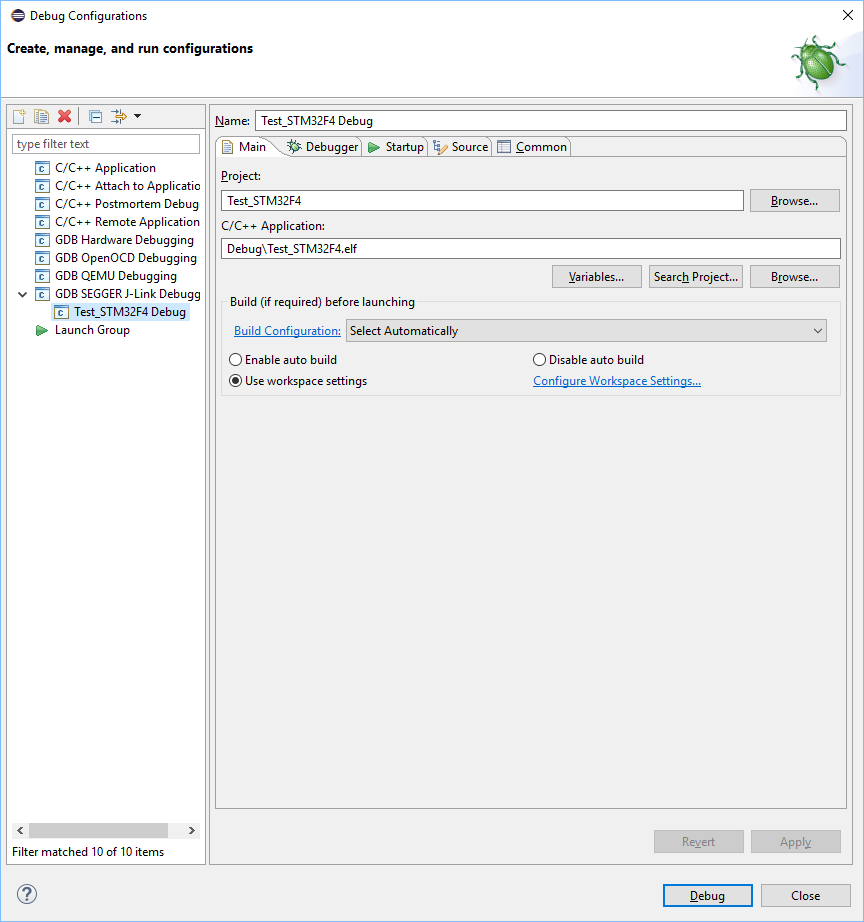
| + | In order to use J-Link Command Strings for a TrueSTUDIO project, the Debug Configurations needs to be edited. |
||
| + | The Debug Configurations are generated with the start of a debug session and can be found under "Run -> Debug Configurations". |
||
| + | From there, select the "Startup Scripts" tab and edit the "Target Hardware Initialization Script". |
||
| + | Make use of J-Link Command Strings by typing "monitor exec <CommandString>" and clicking "Apply". |
||
| + | |||
Please refer to [[Eclipse#Specifying J-Link GDB Server commandline options | Specifying J-Link GDB Server commandline options]]<br> |
Please refer to [[Eclipse#Specifying J-Link GDB Server commandline options | Specifying J-Link GDB Server commandline options]]<br> |
||
Please note that J-Link Command Strings can also be executed from J-Link script files. |
Please note that J-Link Command Strings can also be executed from J-Link script files. |
||
Revision as of 09:50, 30 April 2018
Contents
Eclipse is a universal customizable IDE, which is also the base for many common commercial IDEs. In order to work with Eclipse and debug with J-Link, you also need to install a toolchain which includes compiler, assembler, linker + GDB (GNU Debugger) for debugging (e.g. GNU Tools for ARM). Moreover, in order to allow hardware debugging on embedded systems via GDB + GDB Server, there is also an Eclipse plugin needed, which enables hardware debugging via GDB (e.g. the CDT plugin). After setting up Eclipse + Plugin, Eclipse will use GDB as debugger where GDB communicates via the GDB protocol with J-Link GDB Server, allowing to debug the target hardware which is connected to a J-Link.
Using J-Link Command Strings
In order to use J-Link Command Strings for a TrueSTUDIO project, the Debug Configurations needs to be edited. The Debug Configurations are generated with the start of a debug session and can be found under "Run -> Debug Configurations". From there, select the "Startup Scripts" tab and edit the "Target Hardware Initialization Script". Make use of J-Link Command Strings by typing "monitor exec <CommandString>" and clicking "Apply".
Please refer to Specifying J-Link GDB Server commandline options
Please note that J-Link Command Strings can also be executed from J-Link script files.
